A big GeoSLAM tour of the UK
Dr Neil Slatcher, Chief Product Officer, GeoSLAM
CELEBRATING the unique and varied architecture the UK has to offer, the team at GeoSLAM has travelled the length and breadth of the UK, harnessing lidar technology to capture iconic landmarks. It has seen them share a collection of digitally reimagined 3D scans for a number of recognisable and famous Great British landmarks and continue the work they began to mark the Queen’s Platinum Jubilee when they recreated five Royal London landmarks. All scanned using the ZEB family of mapping solutions, here, GeoSLAM explores how handheld geospatial technology can be used to gain a greater understanding of our cultural heritage and even be used for scientific research.
Eden Project
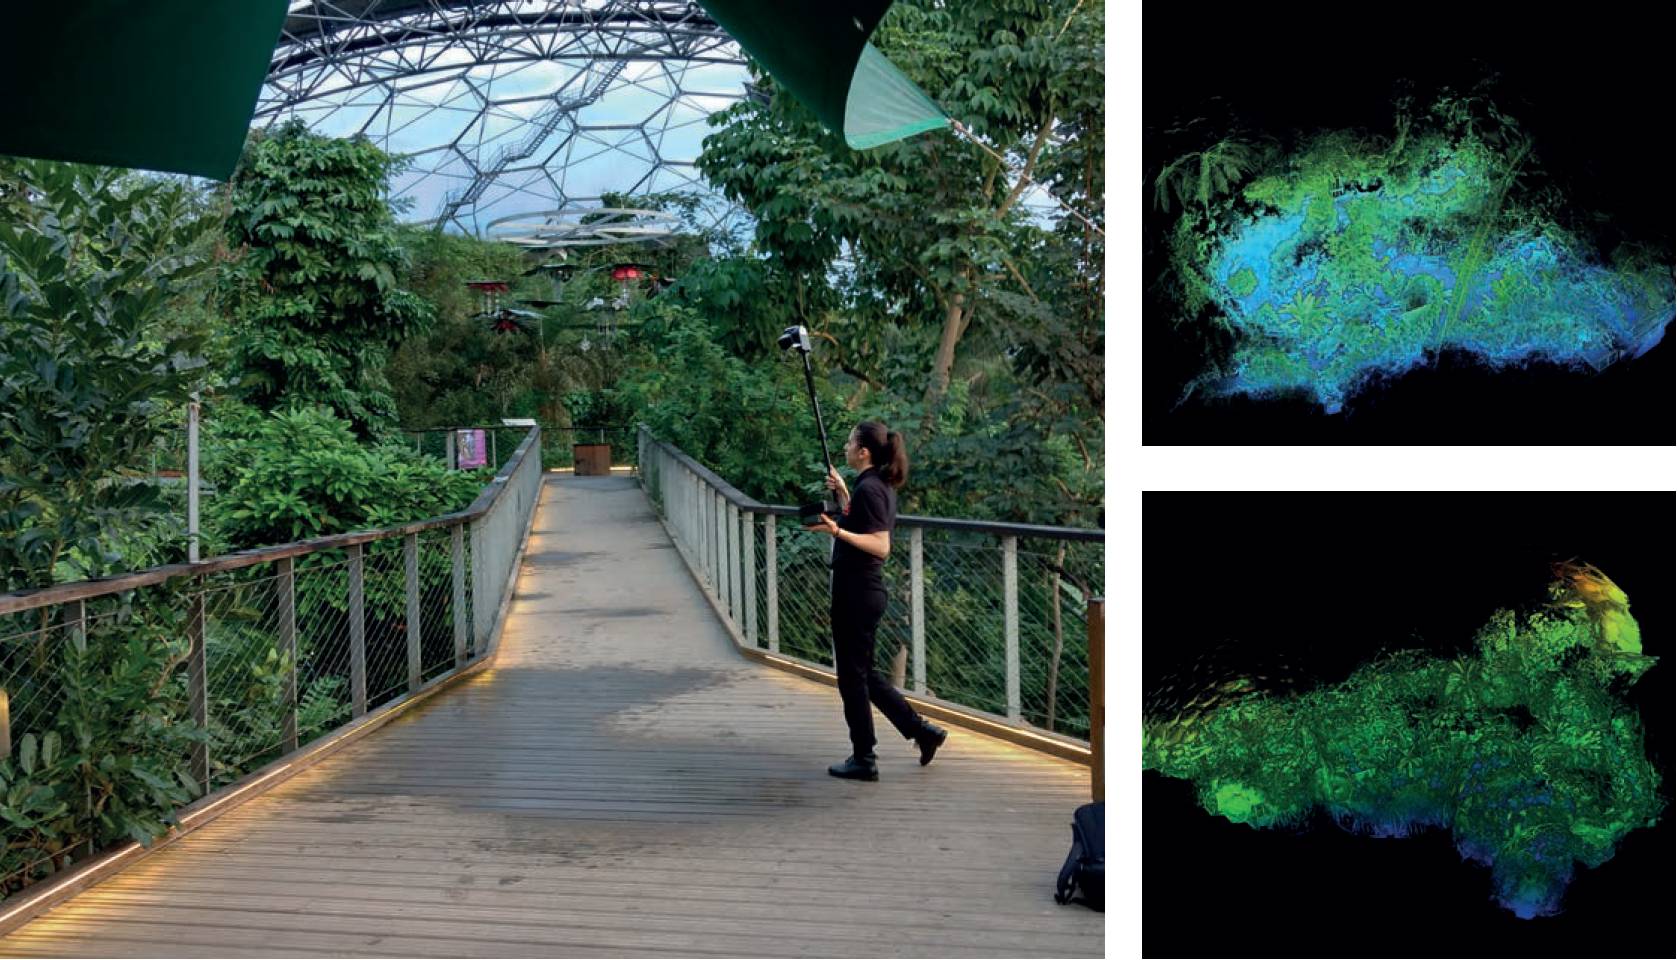
With monitoring and understanding our environment being more important than ever before, as the effects of climate change become increasingly evident, researchers at the University of Leicester visited Cornwall’s famous Eden Project. The idea came about as a result of wanting to use mobile lidar sensors across complex forest environments to further develop a technique to estimate biomass and carbon more efficiently.
GeoSLAM explores how handheld geospatial technology can be used to gain a greater understanding of our cultural heritage and even be used for scientific research.
As one of the world’s largest indoor rainforests, with over a thousand tropical trees and plants, the Eden Project was selected by doctoral researchers from the university as a site to scan because it contains separate biomes housing rainforest and Mediterranean ecosystems. With only a few hours to conduct the scan each day – limited by public opening times – GeoSLAM’s mobile surveying equipment collected data from the densest areas of the rainforest.
They used the ZEB Revo scanner that could be used handheld or mounted to a pole for inaccessible areas. Walking around the rainforest canopy, they captured 43,000 points per second generating a point cloud to provide the foundation for the team’s research. This point cloud data was then converted into 3D volume-based plots, deriving above-ground biomass and carbon densities for multiple types of tropical forest. It resulted in a comprehensive database being built for any type of forest.
Buckingham Palace
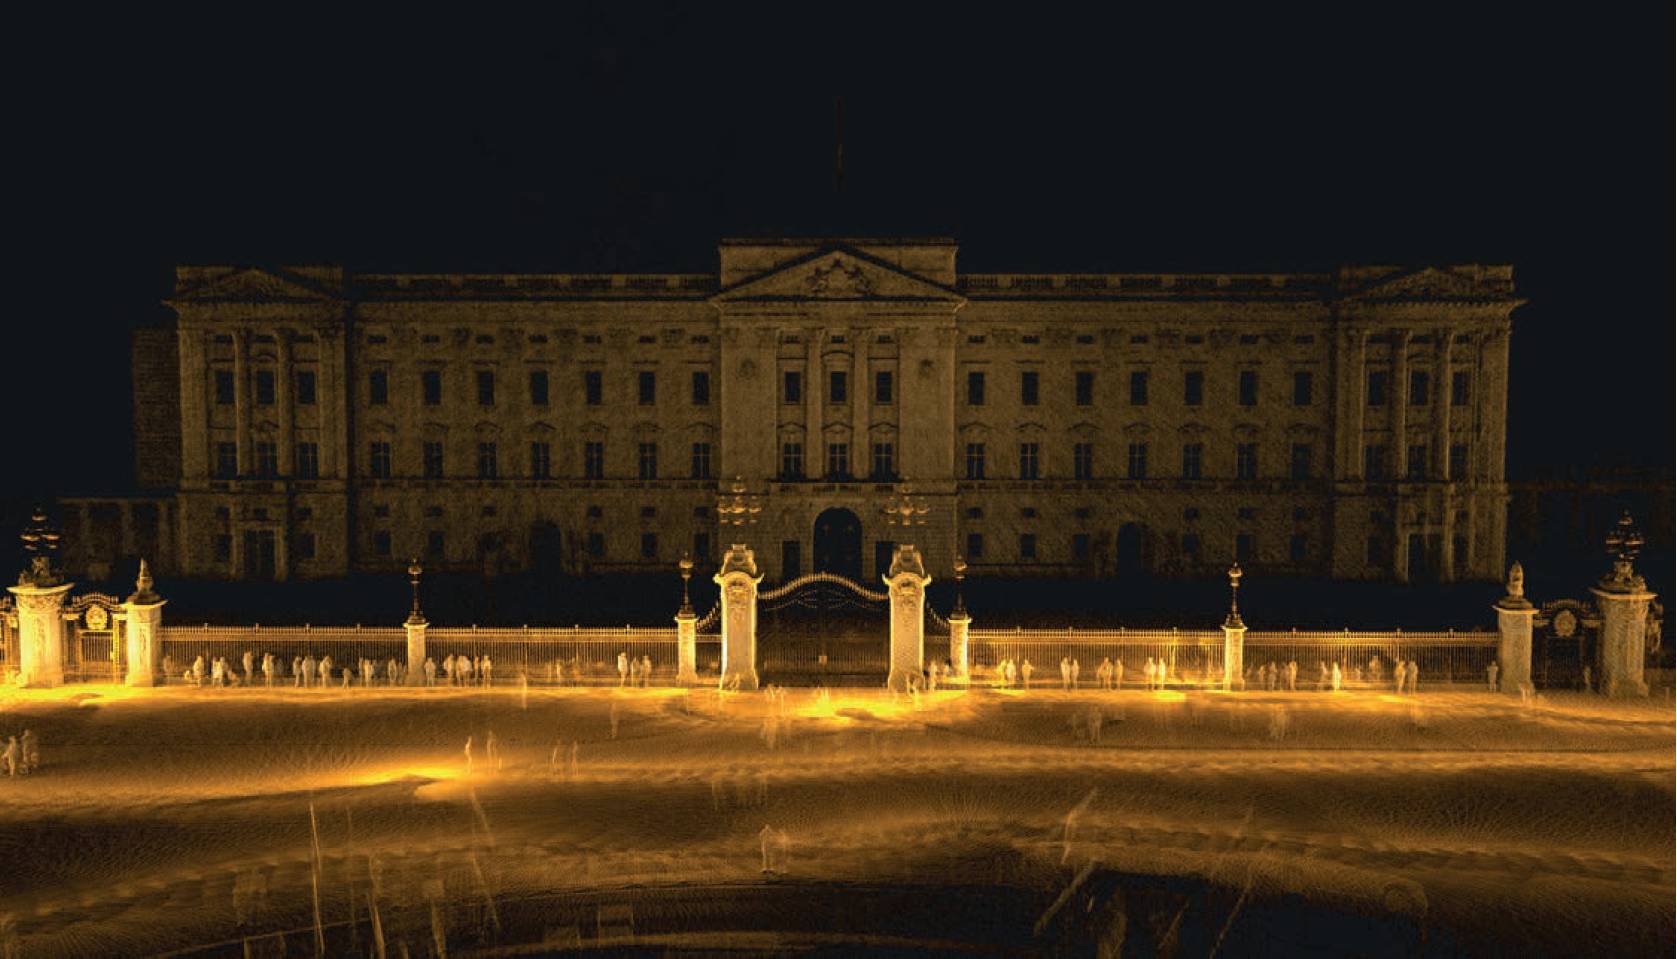
Built in 1703 by John Sheffield, later the Duke of Buckingham, Buckingham Palace is recognised across the globe as the Queen’s London residence and the epicentre of the British Royal Family. With structural additions made in the 19th and 20th century, including reconstruction following bombings during the Second World War in 1940, the palace stands at 108m long, 120m deep and 24m high. A total of 775 rooms, Buckingham Palace is larger than the White House and is the fifteenth largest palace in the world.
All of the landmarks across these pages were captured using the ZEB Horizon, with the data for the front of the royal palace collected in just 23-minutes, with a total of 93.5 million points making up the completed 3D point cloud. To see the Buckingham Palace captured data video in full, visit https://bit.ly/3QzNuFp.
Angel of the North
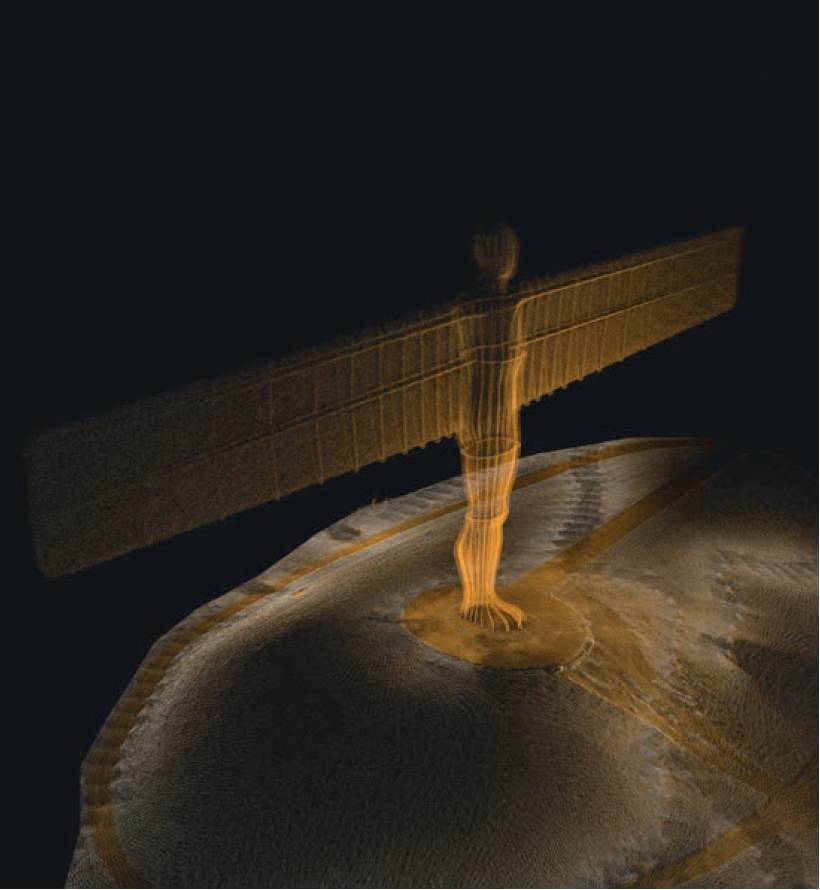
Scanned in just six minutes, Antony Gormley’s iconic Gateshead sculpture, the Angel of the North stands at 20m high, with a total wingspan of 56m. Completed in 1998, it is believed to be the largest sculpture of an angel in the world. The vertical ribs on its body and wings direct oncoming wind to the sculpture’s foundations, allowing it to withstand wind speeds of over 100 miles per hour.
Based on Gormley’s own body, the angel structure was scanned using the SLAM system, from all angles. To view and interact with the Angel of the North sample data, visit https://bit.ly/3K6nyPC.
St Paul’s Cathedral
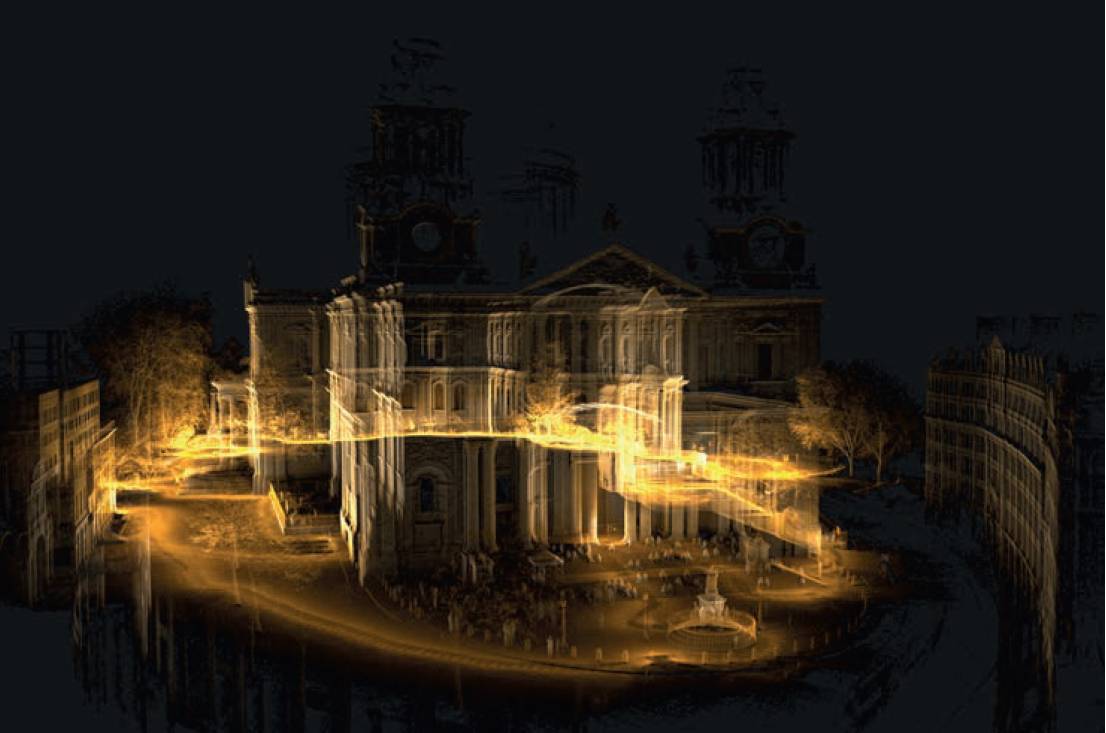
The most visited and utilised cathedral for both royal and state services, including the Queen’s Platinum Jubilee celebrations, St. Paul’s Cathedral is certainly one of the most famous sights of London. Designed by the architect Sir Christopher Wren and built between 1675 and 1710, the cathedral was consecrated in 1697. St Paul’s was the tallest building in London for over 250 years between 1710 and 1963 measuring 111m in total, with its proud tower standing 67m high.
Collected on foot in 19-minutes, the data visualisation contains 134.2 million points, detailing the intricacies of the historic cathedral, surrounding gardens and ornate statues, including the Queen Anne memorial. The captured data video can be found in full by visiting https://bit.ly/3QORUrV.
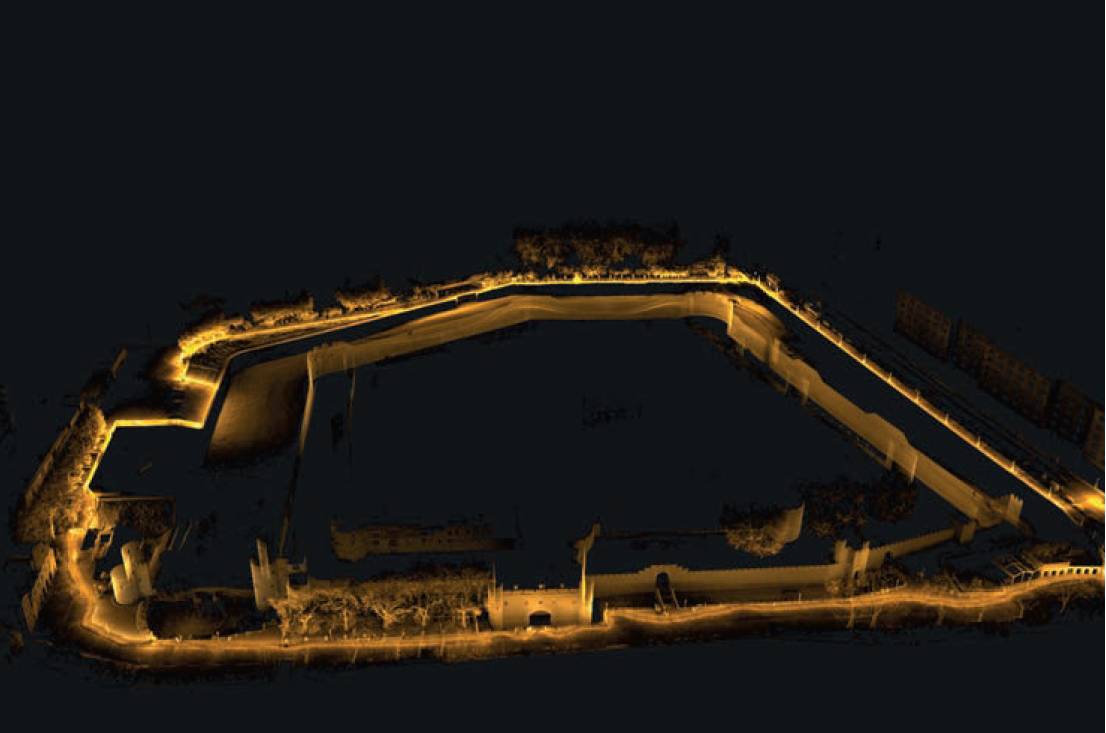
Tower of London
First built under the reign of William the Conqueror in the 1070s, the Tower of London has brought security to the royal family for hundreds of years. Attracting over three million visitors a year, the Tower of London continues to act as the highly secure site of the Crown Jewels, home of the Yeomen Warders and the legendary ravens, as well as nearly 1,000 years of ghostly tales of torture and executions.
With the central tower standing at 27m high, the 18-acre fortress-encased site is vast and complex, with the interior alone taking around four hours to fully explore.
The perimeter of the UNESCO world site was captured in 19 minutes, collecting 73.1 million points. To see the complete Tower of London captured data video in full, visit https://bit.ly/3wczEAR.
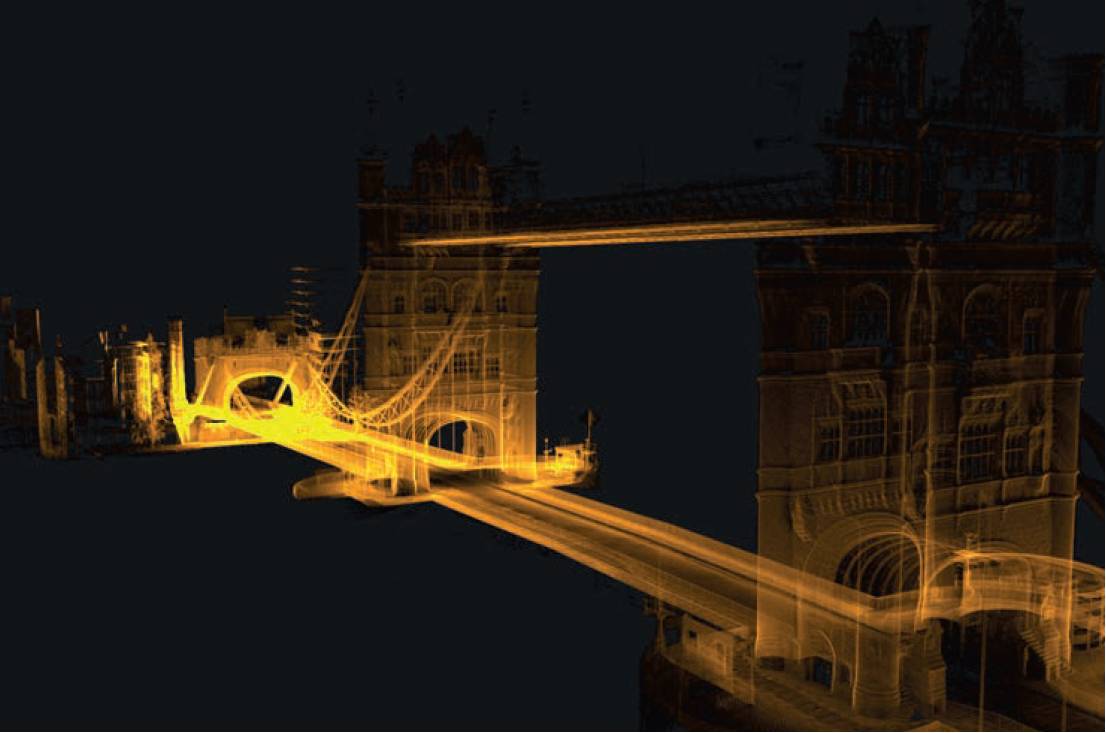
Tower Bridge
The defining icons of London, many believe The Tower of London and Tower Bridge to have been built around the same time, however, it was designed by Horace Jones to blend in with its architectural neighbour around 825 years later, in 1894. It was engineered by John Wolfe Barry, Henry Marc Brunel, and William Arrol, as a combined bascule and suspension bridge.
Spanning 240m across the River Thames and with a maximum height of 65m, Tower Bridge was digitally recreated in 20 minutes, capturing 93.5 million points. View the interactive Tower Bridge dataset, by visiting https://bit.ly/3QrrD33.
Dr Neil Slatcher, Chief Product Officer, GeoSLAM