U-GIS
An introduction to underground GIS
Mark White MCInstCES, Geoscience Manager, LandScope Engineering

THE fundamental principle of a GIS is to provide all records with a geographical location and house all associated data within a ‘behind-the-scenes’ database. This location tag allows records to be displayed in an easy-to-navigate map format and the database allows access to the associated data through a number of simple functions.
This ease of data accessibility and viewing has made GIS commonplace in the management of our natural and manmade world.
Although GIS software is readily available, its utilisation to display and manage utility and subsurface data currently falls well behind that of the more traditional above ground mapping datasets.
Why is GIS underutilised in this area when there are so many advantages to its use? The integration of above and below ground data is surely a powerful combination.
Utility mapping and above ground survey now encompasses a wide range of techniques and technologies to capture and process data. These datasets often require bespoke software packages and considerable expertise to process and interpret.
Although the technology and associated software have improved substantially over recent years, the way that data is delivered to the client remains antiquated in comparison.
Furthermore, each survey technique and deliverable largely remain segregated from one another and require significant cross-examination from the end-user.
U-GIS
U-GIS looks to combine all forms of data into a single platform and open accessibility to both specialists and non-technical stakeholders. Information accessibility is key.
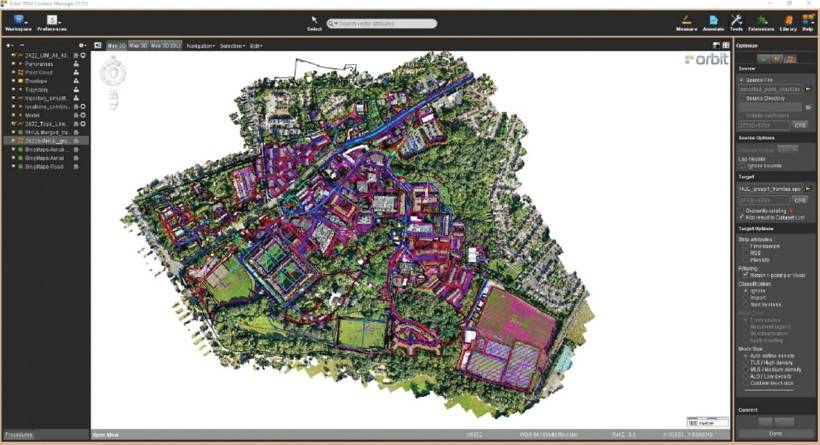
Figure 1: UAS, mobile mapping, mobile GPR, utility service data, topographical data and manhole data shown within 3DM Cloud.
U-GIS is a principle or workflow rather than a particular software or advancement in technology. It represents a smarter and easier way of working. Although specific software examples will be investigated in this article, it should be noted that core data accessibility remains of prominent importance and GIS packages can be utilised dependant on the types of data you wish to display. Many GIS solutions are now open source, whilst subscription-based software offers cloud solutions that simply require a web browser to access.
Firstly, let’s consider the traditional utility survey deliverables. In the simplest of terms this represents a drawing (2D/3D) in a digital and paper format with an associated survey report and manhole schedule. The utility drawing itself is often overlaid on an above-ground topographical survey model.
Although not exclusive, most utility mapping drawings are delivered in AutoCAD or MicroStation format along with a ‘paper’ version, most often a PDF.
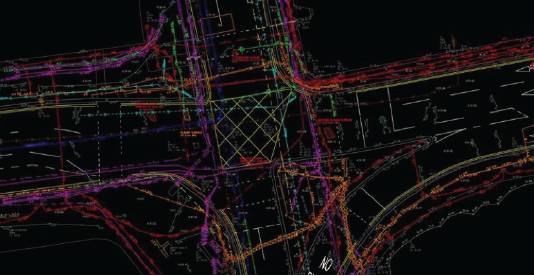
Figure 2: Traditional utility survey data shown in AutoCAD.
Importantly, the U-GIS philosophy is not looking to replace these core industry standard formats, as many end users of the data (architects, consultants, building contractors and so on) rely on these deliverables and they feed directly into various design and modelling packages.
Unfortunately, these established CAD deliverable formats are flat and drawing layout space is limited.
As a result, much of the surveyed data is inevitably excluded from the CAD format as there is simply insufficient space or functionality to store and display it.
U-GIS is looking to repurpose and recycle all the survey data into a single package that allows all users to access and review associated data without any loss of information.
The good news is that with traditional deliverables, all the hard and expensive work has already been completed.
Data can now be easily exported into GIS packages and uploaded into a low-cost or open-source GIS based platform.
LandScope’s primary GIS platform is Orbit 3DM Cloud from Bentley Systems, for two main reasons:
- It has the capacity to read all the key survey datasets. This includes LiDAR, 360º imagery (similar to Google Street View), unmanned aerial system (UAS) photography, traditional linework (topographical and utility mapping), manhole chamber meta data (inverts, pipe diameters), 3D models and much more.
- It is cloud-based. LandScope can provide clients with a link to view all their data in a single environment with only the need for a web browser. The cloud solution allows queries and data reports, the ability to take measurements, and make collaborative annotations.
Utility survey data in U-GIS
The example shown in Figure 3 is an extract from a campus wide topographical and utility mapping survey of Royal Holloway, University of London. Once all the traditional deliverables were completed, LandScope imported the data to 3DM Cloud to produce a digital twin.
This allowed all collected data to be viewed in a single platform.
By simply clicking on a manhole, the user benefits from a huge array of information; the plan view showing where the service runs, a 360º image of inside the chamber, all associated manhole meta data and a 360º image of the chamber location – all within a web browser.
U-GIS is a principle or workflow rather than a particular software or advancement in technology. It represents a smarter and easier way of working.This meant that above and below ground data could be visualised and reviewed by all university departments allowing an unprecedented amount of operational efficiency and cost saving amongst the facilities and asset management teams.
U-GIS is not only for viewing of collected survey data. The database element also allows easy incorporation of legacy data and the ability to constantly update and change the data without losing historical data. This simple ability to update and manage with time mitigates the data currency risk.
For those without software subscriptions, much can be achieved in open-source GIS platforms. These often can’t exhibit as many forms of survey data and are often more challenging to configure, but nonetheless can have powerful results. I’m sure everyone can relate to the example in Figure 4 and would have no issues navigating data in this platform.
Although the concept of U-GIS is currently under-utilised in the utility mapping sector, the industry is showing some promising signs of adoption. The National Underground Asset Register (NUAR) is an initiative backed by the Geospatial Commission and has recently entered the build phase. NUAR aims to show statutory undertakers’ records in a digital format within a custom-built GIS platform. The success of NUAR will hopefully drive the principle of U-GIS forward at an accelerated rate.
Additionally, CICES has recognised the growing importance of GIS within the survey industry and worked with the Association for Geographic Information (AGI) to recently relaunch the GIS competencies to reflect updates within the industry.
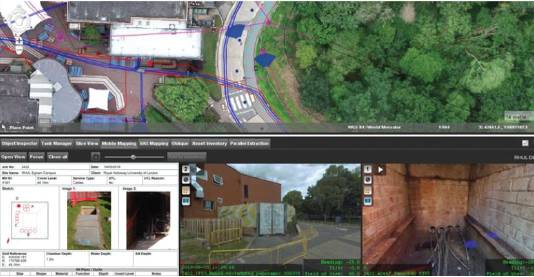
Figure 3: Utility survey data in 3DM Cloud.
Future developments for U-GIS
U-GIS is not only aimed at data availability and accessibility for clients; it has also improved LandScope’s internal workflows.
Our survey teams collect all manhole record data on a bespoke GIS based app, with the ability to push data in both directions.
The site team can upload collected data to the office in real time for evaluation and processing, and the office team can send important information such as statutory record information straight to the field operative to be overlain on the manhole data they are collecting.
A wide range of information is now collected digitally by the field operatives and automatically synced to the cloud at regular intervals.
The requirement for survey metadata is ever increasing as datasets become larger and more varied.
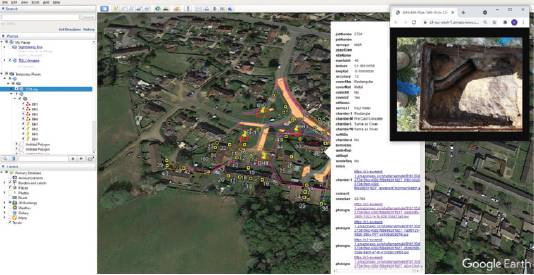
Figure 4: Utility survey data in Google Earth.
As technology and software rapidly develop, so too do the industry standard specifications that we are required to work too. PAS 128:2014 is the current industry guidance for utility mapping and in the new few months there is likely to be an updated version released.
As we continue to develop the ability to capture mass data and these standards improve, there will be demand to include more meta data on deliverables.
Will there be a time that traditional drawing packages become too cluttered and an ineffective way of displaying utility mapping data? U-GIS may well be the solution we are all looking for.
Mark White MCInstCES, Geoscience Manager, LandScope Engineering
mark@land-scope.com www.land-scope.com @LandScopeUK www.linkedin.com/company/landscope-engineering/
Mark White is a member of the CICES Utilities and Subsurface Mapping Panel.