A greying fellow reflects on...
Improving construction productivity
Part 4: Improving productivity through cost monitoring
George Bothamley FCInstCES

IN contributing to the practices which led to improved productivity on the water infrastructure frameworks I looked back to methods that I had been involved with 20 odd years previously which could be adapted to the new situation.
At the start of my career larger construction companies had not long started cost/value comparisons as part of their monthly contract progress reporting. Hitherto their cash flow showed whether they were solvent; they only found historically after contract completion if contracts were profitable or not. A little later it became common to monitor labour and plant costs weekly, and the senior management of the contractor I worked for at the time brought in this requirement.
On the sites that many colleagues worked on, this weekly exercise tied up a couple of engineers for much of the week and resulted in a mass of figures which seldom correlated with those in the monthly report prepared by the commercial surveyor.
The contracts manager for the site I worked on demanded that the exercise took no more than two members of staff half-a-day per week. The project manager for this site, for whom I worked on all of his projects until his career accelerated to the CEO position he later achieved, developed this requirement into simple data which illustrated output and productivity for the few key elements on the contract that formed about 80% of expenditure. Without my knowing at the time, this was using the Pareto Principle, which almost always works; nowadays it is easy to check and find which 20% of items form the 80% of expenditure using most electronic data collection formats.
On a typical civil engineering contract these elements might include structural fill (m3 ), concrete (m3 ), formwork (m2 ), pipework (m). Each would have a graph showing weekly planned and actual output and average unit cost compared with the original forecast average cost (see Graph 1). Back then the graphs were drawn with felt tip pen on the back of a superceded drawing and pinned on a notice board. Nowadays they could easily be generated electronically and projected onto a screen, but I never saw any in the years leading up to my retirement.
Seen and understood
The data will not help productivity if it is just kept in a silo by the compilers or presented as a screenshot of loads of data that is difficult to interpret for most of its viewers. To help improve productivity it needs to be seen and understood by the people who can influence productivity. Our hand-produced graphs were effective. The project manager used to set aside time to consider what could be done with any element of concern, say if the unit cost was higher than original forecast or the output was dipping behind programme or the unit cost was on a downward trend. When he had improved the underperforming elements, he spent time looking to further improve the rest.
The data will not help productivity if it is just kept in a silo by the compilers or presented as a screenshot of loads of data that is difficult to interpret for most of its viewers.
The commercial surveyor might relate a dip in output and productivity to a change that needed to be valued. The construction supervisors might come up with ideas of their own to improve productivity. The whole team was engaged one way or another, and the graphs were a satisfying illustration of how well we were doing.
An earthworks supervisor used to find out from the commercial surveyor what length of kerbing should need a cubic metre of concrete. He then dropped the ready mixed concrete in 1m3 heaps at the appropriate distance apart. This saved transportation of concrete within the site, gave the kerb layer a target to aim for in the shift and reduced material wastage.
A concrete foreman realised that the purpose of blinding concrete was to give a firm surface to prop the reinforcement to the specified cover. He set screeds for a 1m strip at 3m or so intervals before trimming the subbase and filled and trimmed the subbase between them. Thus he only placed about a quarter of the blinding, and after the strips for the first structural pour, he used the inevitable small surplus of structural concrete from each structural pour for further blinding. The labour and material placing blinding concrete was virtually none, as it was done by the team as part of finishing a structural pour using surplus material.
Both of these foremen had a liking for bespoke equipment. The earthworks foreman had on most road jobs a blacksmith make a bespoke excavator bucket profiled for the side ditches, so that excavation and trimming was in one movement. He achieved great productivity then scrapped the bucket; the next requirement would likely be for a different profile. The concrete foreman had a bespoke concrete skip for most major schemes. He carried them round from job to job and most saw repeated use. My favourite only saw two uses, a long time apart. It was used in a steel works where we had use of a 300t overhead crane. The bespoke skip was 3.5m3, so two skips full emptied a concrete wagon. It was a joy to watch, and the guys operating it had no need for gym membership.
All of these examples are from the mechanical age; the digital age will require very different things. But there will be commonality in approach. Foster a culture of wanting to continuously improve productivity using simply presented data to drive it, empower people on the ground to implement initiatives, measure what you expect and what you have achieved.
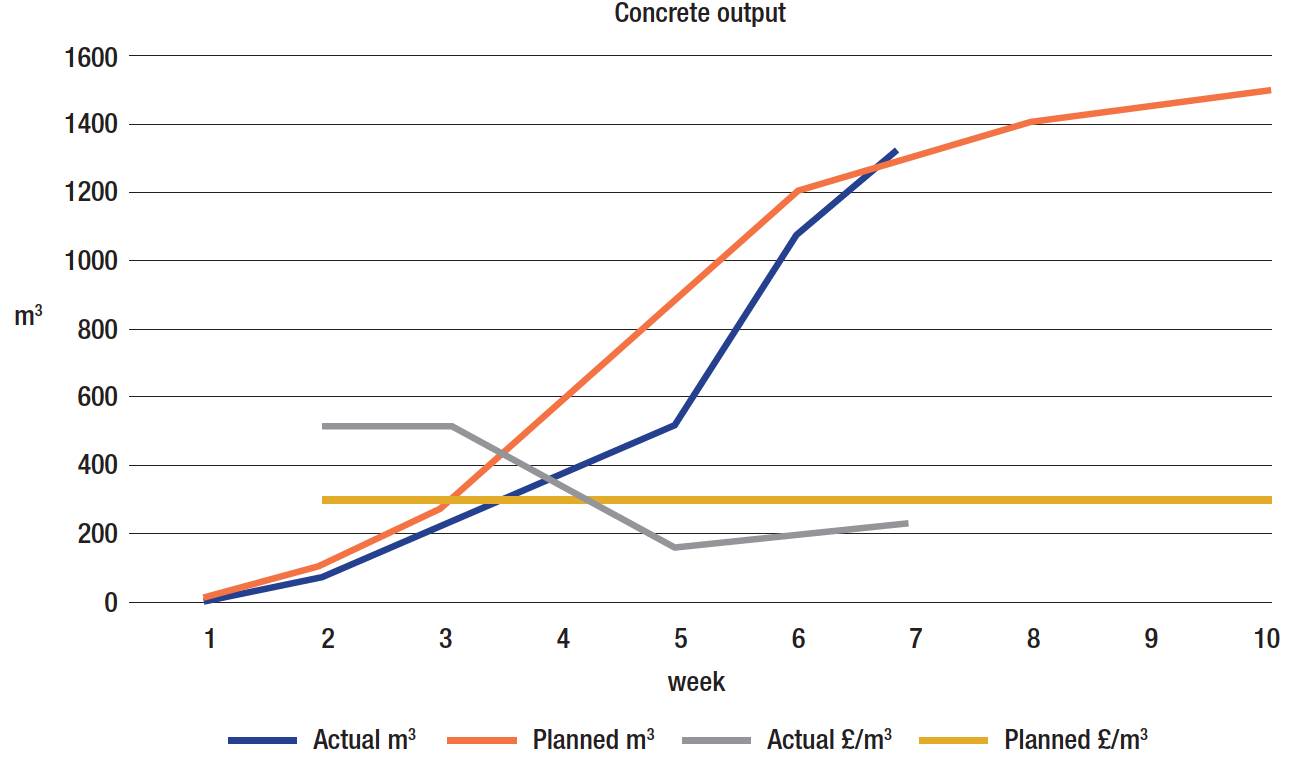
Graph 1: Weekly planned and actual output and average unit cost compared with the original forecast average cost.
Digital age
In the digital age, producing cost forecasts is so much quicker and easier than it used to be. And yet we appear to be no more, and even less, capable of consistently producing cost forecasts of acceptable accuracy than in the analogue age.
In the digital age, producing cost forecasts is so much quicker and easier than it used to be. And yet we appear to be no more, and even less, capable of consistently producing cost forecasts of acceptable accuracy than in the analogue age.This may sometimes be that the cost forecast is achievable but productivity is poor. In other instances, it will be that the forecast is unrealistic. A frequent management response to a project running over budget is to require more frequent updates of the cost forecast. This has always puzzled me. The problem is lack of quality, not lack of quantity. It is surely better to devote more time improving the quality.
Some inaccuracy in forecasting cost will stem from using inherently inaccurate cost data bases. Many are produced from tendered costs, which themselves are an inaccurate, often low, forecast. Those based on actual costs will almost always miss out data from the projects which have a protracted contractual cost dispute and will often miss those completed late in the reporting period, many of which are late because of escalating cost issues. Historic cost databases have a tendency to be lower than the real historic cost.
Cost forecasts are sometimes inaccurate because they have totally missed an element or risk event. In Risk Analysis in Project Management (1993) J Raftery states “in construction budgeting, judgments have to be made between being roughly accurate or precisely wrong.” Spending a lot of time on things you have a lot of detail for then missing or not properly considering other items leads to overall inaccuracy.
A key cause of inaccurate forecasts is not properly accounting for risk. What are the abnormal events that might affect your project? What is the likely probability of them occurring and the cost if they do? What interventions and mitigations should you have if they occur?
Lack of accuracy in cost forecasting has an adverse impact on productivity beyond the effective production of the forecast itself.Too often risk management is discussed towards the end of a meeting and these questions answered glibly if at all. Have a little time out so that they can be properly evaluated. Have a system for evaluating them roughly right and quickly, referring to historic data for risks on similar schemes. In analogue times we had simple methods to quickly assess risks, options, operating costs and carbon effect. Make sure yours are quick and easy to use to produce a roughly right answer, unlike the complex and difficult to use versions I have seen at the start of the digital age.
Lack of accuracy in cost forecasting has an adverse impact on productivity beyond the effective production of the forecast itself. When a cost forecast is wrong, the project requires more resources or time or both. The original plan will have been for an optimum time and resource. For example, if it required ten instrument engineers for ten weeks, the plan would be for the ten best instrument engineers. If it becomes apparent that the work is twice that allowed for in the forecast, it will require the ten best engineers and the ten next best. The latter will be either more expensive or less productive than the ten best. Increased hours may be worked, which is itself less productive.
More people may lead to competition for the same space and equipment, causing reduced output. The number and experience of management and supervision staff will have been set for the original forecast work and the necessary increases will not be immediate. The effect of poor cost forecasting is inevitably to reduce productivity.
On the other hand, improving the accuracy of forecasting end cost will contribute to improved productivity. It is achieved by spending time on value judgments of the data and communicating them. The digital age should give us more time to do this, but only if we use the time saved by more easily produced reports to produce better forecasts rather than more forecasts.
Next we will conclude by looking at more productive use of materials, change and CPD.
George Bothamley FCInstCES