A novel non-destructive sensing technology for on-site corrosion failure evaluation of coatings
Mian Hammad Nazir, and Zulfiqar A. Khan, Bournemouth University, and Adil Saeed, Global College of Engineering and Technology, Muscat, Oman

Introduction
A. Electrochemical tests
To protect objects made of metal, they are coated with corrosion-resistant materials such as polymeric and metal coatings. There are a number of reasons why a particular coating may fail. It is fairly common to ascribe these failures to one of four causes, namely, misapplication of the coating, defective coating, the wrong choice of coating, or exposure to an unanticipated environmental excursion1.
During its service life, the coating undergoes changes in mechanical properties leading to formation of micro-defects including both pores and/or micro-cracks which upon mechanical and/or thermal loading subsequently propagate and expose substrate to atmospheric moisture and oxygen as shown in Fig. 1.
This action results in accelerated disbonding of the paint and flake formation from the coating-substrate interface2
Fig. 1 shows the pore-like defect in a polymeric coating. In Fig. 1 (a), a micro-crack can be seen that initiated from a pore and propagated a short distance3.
These cracks typically propagate roughly parallel to the loading direction. Thus, macroscopic splitting failure under compression likely result from pores (Fig. 1 (b)). For practical applications, it is desirable to deposit continuous, defect-free coatings to achieve optimal performance.
There are numerous porosity tests in the literature. The most latest, powerful, rapid and reliable porosity testing includes the electrochemical techniques 4,5,6.
Electrochemical techniques can be used to expose the underlying substrate in a carefully chosen electrolyte. An appropriate electrolyte will allow contact with the substrate through pores and/or micro-cracks to monitor the corrosion resistance of coating7.
Electrochemical tests include both DC (direct current) and AC (alternating current) tests. DC measurements contain, such as Tafel extrapolation8, cyclic voltammetry9, linear polarisation resistance (LPR)10 and corrosion potential monitoring11.
DC and AC measurements are much more reliable and have been used to determine the percentage through-porosity in coatings on steel and aluminium substrates.
The AC electrochemical measurement includes electrochemical impedance spectroscopy (EIS) 12,13,14.
EIS can provide a powerful tool for electrochemical measurements on coating integrity.
Both DC and AC measurements can be performed rapidly with standard electrochemical instrumentation i.e. electrochemical cell and potentiostat.
These measurement methods (DC and AC) are much more reliable and have been used to determine the percentage through-porosity in coatings on steel and aluminium substrates.
However, such techniques require a proper laboratory setup including potentiostat, electrochemical cells with proper electrode configuration.
Also, such analysis requires appropriate environmental conditions to reduce noise by using Faraday cage15.
In electrochemistry standard laboratory electrochemical cells are used to characterise and analyse micro-defects in protective coatings by using above standard electrochemical techniques 16,17,18.
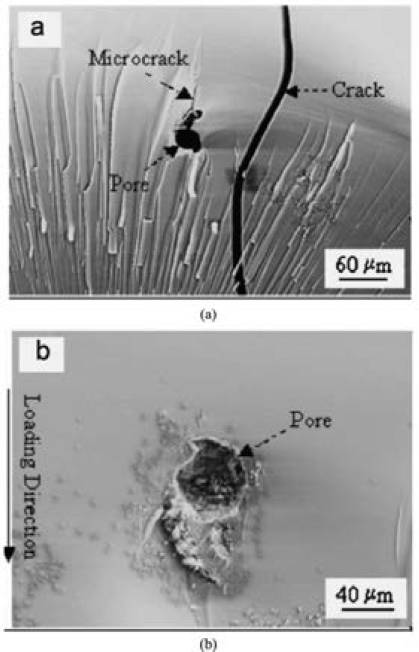
Fig. 1. SEM fractographs demonstrating (a) a pore-like flaw, microcrack , and crack on the fracture surface, and (b) a pore-like flaw, which resulted in macroscopic splitting failure under compression3.
Therefore, the application of these techniques is rather limited to in-lab samples testing and cannot be performed where direct coating condition monitoring of large structures is required for example on-site field testing of oil and gas pipelines, bridges and automobiles.
Therefore, there is a need for a simple and easily accessible electrochemical cell which can facilitate the electrochemical techniques to detect micro-defects and analyse the condition of coatings of large structures during operation.
B. Standard electromechanical cell
A typical electrochemical setup for coatings consists of an electrochemical cell and a potentiostat.
In testing practice, a standard electrolytic cell (the system under investigation) is setup consisting of an electrolyte, a reference electrode (RE), a counter electrode (CE), working electrode sense (WES) and the coated sample of interest as shown in Fig. 2.
The coated sample is called the working electrode (WE) and can be seen to possess micro defects providing the pathways for corrosive ionic species towards the substrate. The WES is required when measuring currents in excess of 200mA.
All the electrodes are connected to an electronic instrument called as potentiostat. The potentiostat applies the potential and analyses the response of the system to determine the electrochemical response of the system.
The reference and counter electrodes are placed in the electrolyte, generally a solution that most closely resembles the actual application environment of the material being tested. The complete cell is placed above the coated sample (working electrode) such that the electrolyte comes in contact with the coated side of the sample.
In the electrolyte, an electrochemical potential (voltage) is measured by the potentiostat as an energy difference between the reference and the working. The current flows between counter and working electrode (shown by green line) which follows the path as: counter electrode –> electrolyte –> coating –> substrate –> working electrode. Although the standard electrochemical cell is significantly used among wider scientific community however the destructive nature of cell due to the direct contact of electrolyte with the coating limits its application when on-site field measurements are required as shown in Fig. 2.
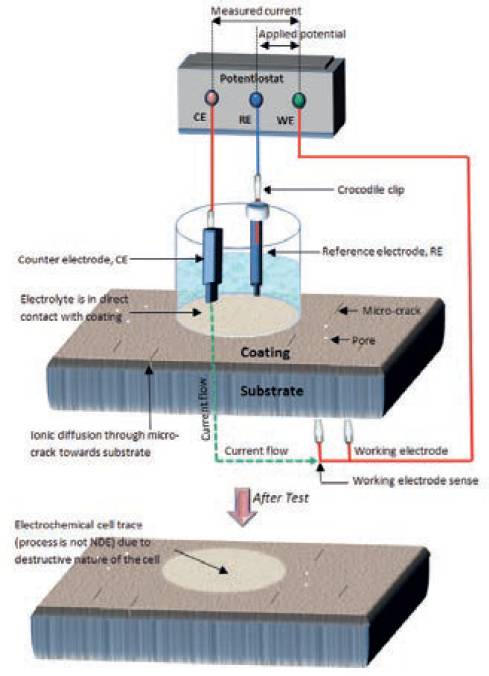
Fig.2. Schematic diagram for standard electrochemical cell setup for performing the electrochemical analysis of coating.
The coating area exposed to the electrolyte can lose its adhesion and can later on result in complete failure during application.
The most basic form of the cell has two electrodes (2-electrode configuration) as shown in Fig. 3 (a). The potentiostat cell cables WE+WES leads are connected together to working electrode and cell cable CE+RE leads are connected to counter electrode as there is no reference electrode. It is also used in measurements of electrochemical measurements at high frequencies (> 100 kHz), especially when the thickness of coating is very large or the coating is in very good condition (defect-free - ideal)19. A three-electrode configuration for an electrochemical cell is most common for typical electrochemical applications.
The cell cables WE+WES leads are connected together to working electrode however due to the addition of reference electrode cell cable CE connects to counter electrode and cable RE connects to reference electrode.
A third additional electrode (the reference electrode) is used to determine the potential across the electrochemical interface accurately as shown in Fig. 3 (b). Such setup gives reliable results for damaged coatings which poses large defects200.
Cell schematic in Fig. 2 is a three-electrode configuration20.
Previous investigations on coating life assessment and corrosion damage measurement of the substrate in real time were reported in 21,22,23,24,25,26,27,28,29,30,31,32,33,34.
To determine the quality of the coating and the resulting rate of corrosion of the underlying metal substrate, a variety of corrosion measurements can be done (Tafel, EIS).
To facilitate these measurements, in the present work, we develop an on-site field electrochemical sealed cell which can easily be used to perform the corrosion rate analysis of the underlying substrate and non-destructive coating quality assessment. The cell can detect the micro-defects in coating.
The cell can be used in applications like infrastructure, automotive and aerospace.
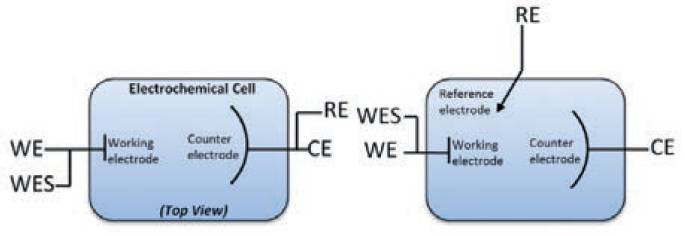
Fig.3. Schematic overview of the (a) 2-electrode setup (b) 3-electrode setup.
Sealed magnetic cell which is fabricated using stainless steel and can clamp with the substrate is already commercially available but the downside of such cell is that it uses an external permanent magnet to clamp the cell with the substrate.
There are three downsides of using external permanent magnet, firstly it reduces the contact area of cell with the substrate by occupying a large area on cell’s outer body, secondly the magnetic field of permanent magnet directly affects the micro-ampere level highly-sensitive current which can reduce the reliability of results, thirdly, the external magnet can itself corrode during the corrosion evaluations.
Another downside is the use of stainless steel in fabrication as it has poor electrical conductivity and relatively low corrosion resistance. These drawbacks have been addressed by developing a sealed magnetic case of magnetic aluminium compound AlnXn which has high electrical conductivity, high corrosion resistance and strong clamping power.
The AlnXn built cell does not need external permanent magnet. Also, AlnXn built cell in combination with a specialised gel can be used to detect the defects (pores and micro-cracks) and condition of coating. The AlnXn cell shares some common manufacturing features with commercially available cell for example inlet filling tube and outlet air vent tube and the electrode positioning however AlnXn built case and its distinct working mechanism by using the specialised gel significantly improves the efficiency and reliability of AlnXn cell.
II. Portable electromechanical cell (PEC)
A. Fabrication
The PEC system unlike standard electrochemical cell is a portable cell with a magnetic body which can be attached to any horizontal, vertical and upside down metal object. In this way the object constitutes the bottom of the PEC and the object itself can be used as an electrode. The cell can be filled with the electrolyte (3.5% NaCl solution) by using a tube that leads directly into the cell.
A similar tube allows air to escape to ensure a completely filled cell in order to prevent air pockets inside the cell compartment. The inlet filling tube is positioned in a way such that it is always lower in level compared to outlet/ air vent tube.
Another purpose of inlet and outlet tubes is for cleaning the cell by flushing the used electrolyte out and filling it with fresh electrolyte. PEC design does not allow the electrolyte to come in direct contact with the coating due to magnetic aluminium compound AlnXn base of cell which ensures non-destructive monitoring of coating condition. AlnXn has been specifically chosen for fabricating PEC to obtain optimum corrosion monitoring data due to its exceptional electrical conduction and corrosion resistance properties. AlnXn is prepared by doping aluminium with ferrite nanoparticles 35.
There are two main parts of PEC: (i) the bottom and (ii) the cell lid. The circular bottom of PEC consists of AlnXn area which constitutes the counter electrode. AlnXn electrode is magnetic which allows the cell to be easily placed on the metal surface.
From bottom to top this consists of two layers: the AlnXn container and the cell lid (side view). The AlnXn container holds the electrolyte such that the container is tightly sealed to the lid using silicone gel to avoid any electrolyte leakage.
The reason for selecting AlnXn as a counter electrode is its lightweight, corrosion resistance and high electrical conductance especially for sensing µ Amp and PicoAmp corrosion currents for high impedance coatings (defect-free). The top lid holds the electrode connector, two filling holes and a reference electrode. The reference electrode (saturated calomel) is placed near the counter electrode for accurate measurement.
B. Description of use
PEC has an advantage over standard electrochemical cell that because of its completely sealed design it can be attached to metal objects with any orientation (vertical, horizontal, upside down) which allows its restriction-free use in the laboratory as well as on the field as shown in Fig. 4 (top left).
The object it has been attached to can be used as counter (or working) electrode. This object can be both coated and an uncoated structure. For non-destructive testing of coated object (without damaging the coating), an additional PEC is used as a second electrode which works in combination with the first PEC.

Fig. 4. The top left image shows the corrosion monitoring of a steel-coated ceiling bar. The top right image shows the type of leads. Two PEC are being used together for analysing the condition of coating in a two-electrode configuration in top right and three-electrode configuration in the bottom left. This non-destructive systemis able to detect the micro-defects over the large surface area of coating.
This combination allows the condition monitoring of large coated structures with no possibility to reach the metal substrate. The two PECs in combination can work both in 2-electrode and 3-electrode configurations by using the leads shown in Fig. 4 (top right).
Fig. 4 (bottom left) shows the two electrode configurations in which the base metal cannot be accessed, the potentiostat cell cable CE+RE leads are connected together to the stainless steel electrode of PEC1 (red socket). The potentiostat cell cable WE+WES leads are connected together to the stainless steel electrode of PEC2 (red socket). In the shown 2-electrode connection no reference electrode is used.
However, if reference electrode is used to form a 3-electrode configuration, a reference electrode in PEC 1 is connected by using cell cable RE lead as shown in Fig. 4 (bottom right). The cell cable CE lead is connected to counter electrode in PEC 1 while cell cable WE+WES leads are connected together to the working electrode of PEC 2. C.
Working mechanism
When both PECs are attached to the polymeric-coated steel an electrochemical cell is formed between the AlnXn electrodes in the back of both PECs. Connecting the potentiostat cell cable WE+WES leads to the AlnXn electrode of PEC2, and the potentiostat cell cable leads CE+RE to the AlnXn electrode of PEC1, a 2- electrode configuration is formed. If reference electrode is connected to cell cable lead RE, a 3-electrode cell is formed. Schematic representations of both the 2- and 3- electrode configurations are shown in Fig. 5 (a-b).
Like standard cell, in PECs, the current also flows between working and counter electrode. However, unlike standard cell it has to pass through the coating twice.
Using two PECs results in the path of current It that flows from electrode PEC 1 –> electrolyte 1 –> coating –> substrate –> coating –> electrolyte 2 –> electrode PEC 2.
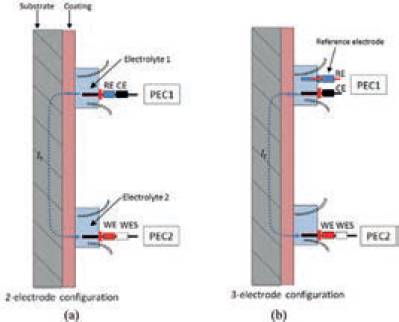
Fig. 5. Schematic representations of (a)2-electrode configuration PECs and(b) 3-electrode configuration PECs.
A metal covered with an undamaged coating generally has very high impedance resulting in negligible current It flow mostly in PicoAmp as shown in the equivalent circuit in Fig. 6 (a).
The model includes a very high resistor R1 (due to electrolyte resistance) and a very low coating capacitance C1 in series. In the case of a coated metal in contact with the electrolyte through PEC’s counter electrode (at bottom), the substrate metal is one plate, the coating is the dielectric, and the electrolyte in PEC is the second plate as shown in Fig. 6 (a).
Capacitors in electrochemical analysis often do not behave ideally. Instead, they act like a constant phase element (CPE)36. Thick, high-quality coatings characteristically have almost infinite impedance and very low capacitance. It is obvious that their high impedance results in very small response AC currents It, especially at low frequencies where impedance element in the model dominates. On a more subtle level, their low capacitance results in small AC currents.
Most coatings degrade with time, resulting in more complex behaviour. The degradation results in the opening of pore(s) and/or micro crack(s) in the coating. As pores in the coating begin to expand over time, the resistance R2 associated with these pores (also called pores resistivity) increases. Also degradation results in the increase in the coating’s capacitance C1. An increase in coating capacitance represents deterioration of the coating’s ability to shield the metal substrate from the environment. The equivalent circuit for this situation is in Fig. 6 (b).
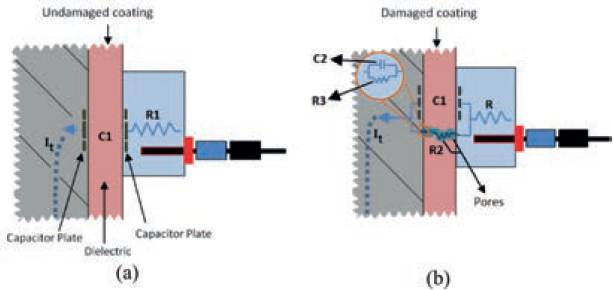
Fig. 6. Equivalent circuit in 2-electrode configuration (a) undamaged coating (b)damaged coating.
On the metal side of the pore, it is assumed that an area of the coating has delaminated and a pocket filled with corrosive solution from an outer environment has formed as shown by orange circle in Fig. 6 (b).
This solution has reached to the bare metal through pores. The interface between this pocket of solution and the bare metal is modelled as a double-layer capacitance C2 in parallel with a kinetically controlled charge transfer resistance R3. Once the model has been fitted to the data, changes in the model’s parameters offer insight into the health of the coating.
The setup shown in Fig. 5 and 6 can only monitor the condition and detect pores in the coating area which is directly under the PEC. This is because that only the coating area which is directly under the PEC acts as a conductive region for the current It between the counter electrode and metal substrate.
The pores which are not located under the PEC will not be detected. In order to detect such pores an alternative conductive path (path 2) is needed between the electrode of PEC and the substrate such that the current can flow from electrode to pore and then from pore to substrate via path 2. Path 2 is created by uniformly spraying a thin film of easily removable, non-reactive corrosion resistant electrically conductive gel on coating, which comes in contact with the pores forming a closed path between counter electrode and substrate.
After the gel has been sprayed, there will be two parallel paths: path 1 and path 2. Path 1 is via an undamaged coating region therefore it has very high impedance resulting in negligible current flow It1 while path 2 contains pores causing low impedance which results in large current flow It2. The net current It which flows between PEC 1 and PEC 2 is given as: It =It1 +It2.
The magnitude of current It2 which flows through path 2 depends on the pore resistivity R2. Smaller R2 (meaning large-sized pores) accounts for large current It2 which increases the net current It and vice versa. Similarly, the magnitude of current It2 through path 2 depends on the number of pores ‘n’ in this path, each pore having resistance R2-1, R2-2, R2-3 up to R2-n respectively. The larger the number of pores, the larger is the current It2 which consequently results in larger net current It.
The change in the net current It is monitored by using Tafel measurement. This change is monitored corresponding to changing linear potential scan from E start to E end on the counter electrode.
The results are displayed as I – E graph on computer software interfaced with potentiostat. The scanning is performed while increasing the effective area of thin film of corrosion-resistant electrically conductive gel by spraying. As soon as the conductive gel comes in contact with the pores, a closed path (path 2) is formed between the counter electrode and the substrate which results in the rapid initiation of current flow through path It2.
The initiation of current It2 adds up with the negligible current flow It1 which is flowing through non-degraded high impedance path (path 1) resulting in the increase in net current as: It = It1 +It2. This sudden rise in It can be observed in the form of large trough in I - E graph.
This large trough clearly indicates that the gel has encountered a defected area which can be treated. The Tafel slope is calculated from I - E graph to calculate the corrosion rate of coated substrate.
Once the defected area has been detected by using Tafel measurement, the same equivalent circuit (path 1+ path 2) is also used for EIS measurement to estimate the values of equivalent circuit parameters: electrolyte resistance R1, coating capacitance C1, pore resistance R2, double layer capacitance C2 and charge transfer resistance R3 by using Nyquist and Bode plots. These parameters help to identify the condition of coating.
The graphical analysis for Tafel and EIS measurement is discussed in the results section in detail. Thus, the complete coating condition monitoring analysis can be divided in to two stages: (1) Detecting the micro defects by using Tafel measurement and (2) Identifying the condition of coating through parametric evaluation of equivalent circuit by using EIS measurement.
III. Experiment
A five-step experimental study was performed by using a 420mm×430mm aluminium sample coated with polymeric epoxy resin in black. The equivalent weight and density of aluminium are 26.9g and 2.7g/cm3 respectively. For the most part, epoxy coatings are used as functional coatings for substrate protection where corrosion resistance, impact resistance, and adhesion are essential.
This coating is normally used in industrial equipment, automotive components, metal furniture and appliances37. The objective of this experiment was to detect invisible micron and sub-micron level defects (pores) and to determine the condition of defected coating by using a custom-developed PEC.
Portable electromechanical cell has an advantage over standard electrochemical cell that because of its completely sealed design it can be attached to metal objects with any orientation (vertical, horizontal, upside down) which allows its restriction-free use in the laboratory as well as on the field.
In the first step, a selected area on the coated sample was subjected to 5% NaCl solution for 72 hours.
This process was performed to degrade the specific area of coating under the glass which resulted in the opening of pores in the coating.
In step two, the microscopic analysis of the subjected area was performed which was compared with the microscopic images taken from the non-subjected area of coated sample.
In step three, the two PECs were installed on the sample in a 2-electrode configuration.
In next step four, a thin film of corrosion-resistant electrically conductive gel was sprayed on coating by using a precise gel coat spray gun. The gel is non-corrosive, non-reactive and can easily be removed by using a dry wipe. The gel was sprayed in a stepwise manner such that the coverage area of gel was slowly increased until it incorporated the degraded area beneath it.
At the same time the Tafel scan was also performed, in which the potential on counter electrode was increased from -3 V (E start) to +3 V (E end) which resulted in the corresponding change in net current It. The scan rate (from -3 to +3V) was set to a low value of 20 mV/sec which resulted in large scan duration giving enough time to increase the coverage area of gel gradually.
In step five, as the conductive gel came in contact with the degraded area it resulted in the formation of a closed path (path 2) between the counter electrode of PEC 1 and the substrate. It is at this specific instance that the sudden rise in It is observed in the form of large trough in I - E graph indicating the location of defected area on coating.
EIS measurement was then performed on this defected sample measuring the parametric values of capacitances (C1, C2) and resistors (R1, R2 and R3) of the equivalent circuit to determine the condition of coating. AC measurement on coated sample by using two PECs in a 2-electrode configuration can be used for EIS measurements where an AC signal is applied around OCP (open circuit potential).
Such a measurement will result in 2* coating impedance (ZCPE), because the path of the current passes the coating twice. In the current experimental setup, the parametric values are calculated by applying AC signal with a frequency varying from 0.06Hz to 1MHz.
Before performing the five-step experimental procedure, the Tafel and EIS measurements of the undamaged coating sample (prior to NaCl exposure) was also performed by using PECs in order to conduct the comparative analysis between the results of the damaged and undamaged coating sample.
IV. Results
The results obtained from the experiment were divided into two stages: (1) defect detection stage by using Tafel measurement and (2) parametric values evaluation stage of equivalent circuit by using EIS measurement.
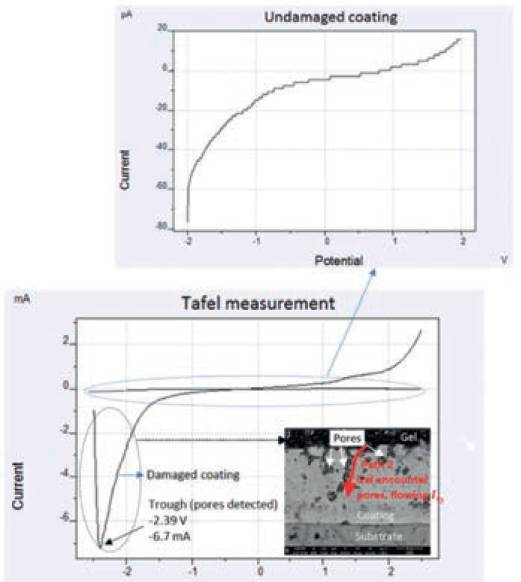
Fig. 7. Tafel measurements for both the damaged (bottom graph)and undamaged (top graph) coatings. The graph for the damaged coating shows the trough which indicates the detection point of pores on damaged coating during Tafel scanning.
A. Tafel measurement
The results from the experimental setup, are shown in Fig. 7. It can also be seen from the trend of damaged coating that the Tafel scanning was performed from -3V to +3V at the same time when the coverage area of gel was increased by spraying. As the coverage area was increased during scan, the gel encountered the pores at E = -2.39V which resulted in the sudden drop in net current It to a level -6.7mA and then t the subsequent exponential rise in It.
This sudden drop and rise in It was observed in the form of a trough, indicating the detection point of pores. The exponential rise in It is associated with the formation of low impedance conductive path 2 through pores resulting in large current flow It2.
The cross-sectional microscopic image of coating-substrate interface on the right of the graph shows the instance when the gel encountered the pores and resulted in the formation of a trough due to development of path 2 causing large current flow It2.
Comparison between the Tafel measurements from damaged (after NaCl exposure) and the undamaged (prior to NaCl exposure) coating can also be seen in the graph.
Undamaged coating possesses only one high impedance path (path 1) for current flow It1, therefore the magnitude of net current It is extremely small, mainly in µA’s as can be seen in Fig. 7.
However, damaged coating possesses two paths (path 1 + path 2), therefore, the magnitude of net current It is high because of the formation of an additional low impedance path 2 (due to the presence of pores) eventually adding more current: It =It1 +It2, mainly in mA’s. It can also be seen that for damaged coating the current reached to maximum peak current of 2.4 mA which is certainly a very high current indicating the presence of low resistive large-sized pores within the damaged area.
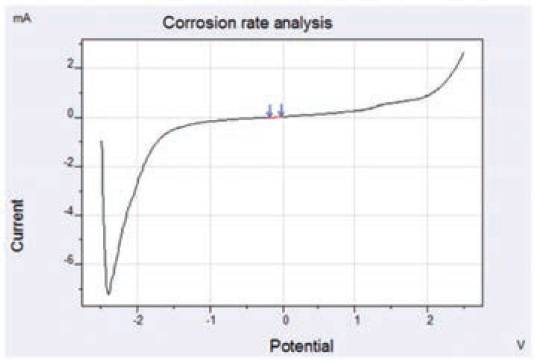
Fig. 8. Measurement of corrosion rate by using ‘slope analysis’ approach.
‘Corrosion rate’ analysis of the damaged coating was performed to determine the corrosion rate of epoxy-coated aluminium substrate.
The rate of corrosion can be analysed by using any one of three approaches:
- Slope analysis.
- Tafel analysis.
- Model analysis.
In this study all three approaches were used for in-depth analysis of corrosion rate.
The comparison of the results obtained from all three approaches helped to validate the accuracy of results.
At first, the ‘slope analysis’ was performed as shown in Fig. 8.
Slope analysis identifies the corrosion potential and the polarisation resistance RP at the zero current intersection point.
The ‘Tafel analysis’ was performed on the damaged coating to calculate the corrosion parameters from the two Tafel lines as shown in Fig. 9.
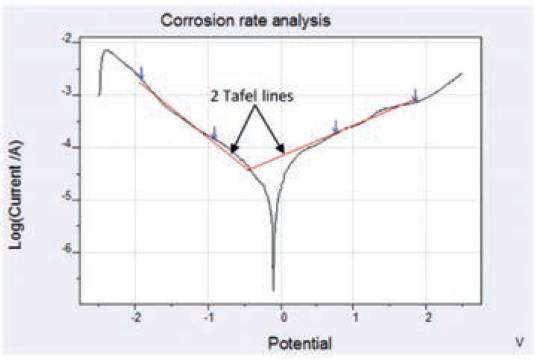
Fig. 9. Measurement of corrosion rate by using ‘tafel analysis’ approach.
Further the corrosion parameters were calculated with a numerical analysis of the available data by using ‘model analysis’ as shown in Fig. 10.
‘Corrosion rate’ analysis of the damaged coating was performed to determine the corrosion rate of epoxy-coated aluminium substrate. The rate of corrosion can be analysed by using any one of three approaches: slope analysis, tafelanalysis, modelanalysis.
Model analysis utilises the material constants i.e. surface area, equivalent weight and density (already identified in previous section) to calculate the corrosion data. The Model analysis is expected to yield the best results in most cases, because it applies complete Butler-Volmer to full data range therefore model data results are most reliable compared to slope analysis and Tafel analysis.
Comparing the corrosion parametric values obtained from all three approaches shows a minute difference in the values of certain parameters. The analysis of Rp shows values close to one another in between 0.0652 and 0.0674 Ohm for all three approaches.
Likewise corrosion rate shows values in between 0.2188 and 0.3867 mm/y.
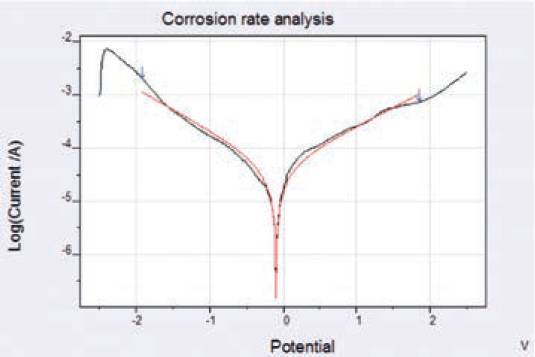
Fig. 10. Calculation of corrosion rate by using ‘Model analysis’ approach.
B. EIS measurement
Once the defected area and the corrosion rate of the damaged coating sample has been determined by using Tafel measurement (after performing all five steps), an EIS measurement was done on the same damaged sample in a 2-electrode configuration.
The EIS scan was performed between 0.06 Hz start and 1MHz end frequency with 20mV amplitude and E = 0V vs. OCP (Open Circuit Potential).
EIS measurement was performed to determine the parametric values (R1, C1, R2, C2 and R3) in the equivalent circuit (Fig. 11) by using various plots for example Bode, Nyquist plots.
Undamaged coating possesses only one high impedance path (path 1) for current flow It1, therefore the magnitude of net current It is extremely small, mainly in µA’s.
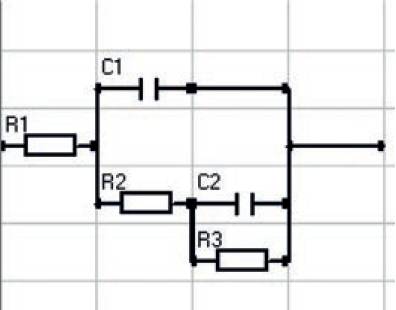
Fig. 11. Equivalent circuit for the damaged coating.
Fig. 11 shows the circuit for the damaged coating accepted by most coating researchers.
The Bode plot for both damaged and undamaged coating samples are plotted in the same graph in Fig. 12.
It can be seen that initially at low frequency i.e. 0.06Hz (10log(f)/Hz = -1), the corresponding impedance (10log|Z|/Hz) for both damaged and undamaged coating stayed high till 10log(f)/Hz = 0.2.
After this point the impedance for damaged coating drastically decreased while for the undamaged coating it still sustained to the same level as before till 10log(f)/Hz = 3.8 was achieved which is very high frequency.
Similarly, for damaged coating the corresponding phase angle reached to a high level just after start while the corresponding phase angle for undamaged coating remained low till it reached a high frequency of 10log(f)/Hz ≈ 2.
Therefore it can be concluded that the undamaged coating has greater ability to sustain higher frequencies compared to the damaged coating. Bode plots is Fig. 12.
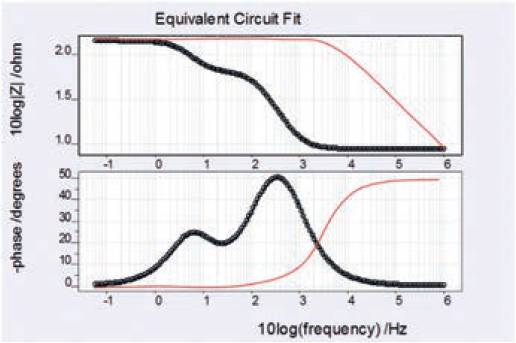
Fig. 12. Bode plot for the damaged and undamaged coating.
Bode plots are used to evaluate only the impedance behaviour of coating w.r.t. varying frequency.
Fig. 12 shows a typical Nyquist diagram derived from the experiment.
The Nyquist diagram is in the form of a semicircle.
The diameter of the semicircle extrapolated in the Nyquist diagram represents the charge transfer resistance R3 which is equivalent to the polarisation resistance Rp 38.
Therefore the larger the diameter of the semicircle the higher the resistance, Rp, and hence, the lower the corrosion rate. It is evident from the plots, that the diameter of undamaged coating is far larger (in the power of E+03) than the diameter of damaged coating.
Comparative analysis between both damaged and undamaged coatings show that the coating capacitance C1 for the undamaged coating is low (1.722 E-08) compared to the damaged coating (2.152 E-05). Likewise the pore resistance R2 for the undamaged coating is high (2.382 E+03) compared to the damaged coating (5.805 E+01). The charge transfer resistance R3 (equivalent to the polarisation resistance Rp) for the undamaged coating is high (7.532E+03) compared to the damaged coating (1.980 E-02).
As higher Rp accounts for the low corrosion rate, which can also be seen from R3 for the undamaged coating that the R3 is higher compared to the damaged coating. The double layer capacitance C2 for the undamaged coating is low (6.682 E-07) compared to the undamaged coating (5.126 E-04) showing that undamaged coating has higher impedance and therefore more corrosion resistant.
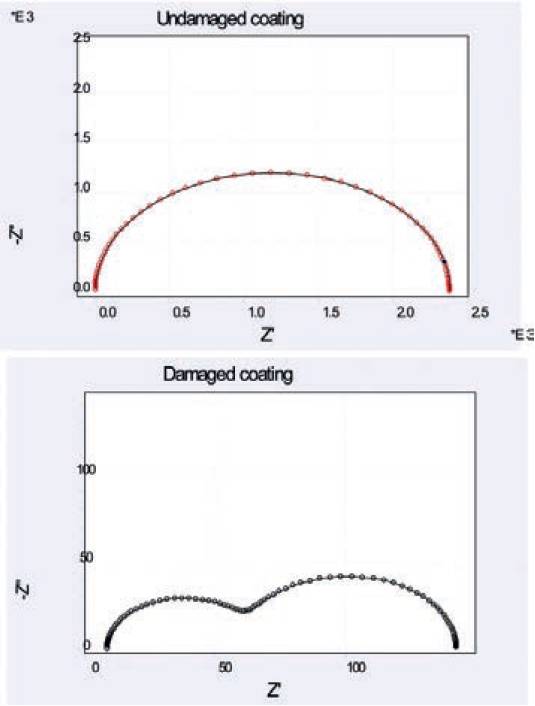
Fig. 13. Nyquist plot for the damaged (bottom) and undamaged (top) coating.
V. Onsite field testing
A. Example 1 – Automobile coating
Portable electromechanical cells were installed on an overhead bridge to measure the condition of coating. Visual inspection showed that the coating of the bridge was significantly damaged.
Measurements in the field have been carried out to test and validate the PEC performance. In the first example, the PECs were installed on the back door of a car coated with (D47 storm blue paint) to assess the condition of coating by using EIS measurement.
The same measurements were also done with the standard electrochemical cells and the results were compared as shown in Fig. 14 (Red trend lines).
EIS measurement from PECs was then used to calculate the parametric values of the equivalent circuit to measure the condition of coating.
The coating’s capacitance C1 was high (2.342 E-08) which indicated that the condition of coating was good and possessed a good ability to shield the metal substrate from the environment.
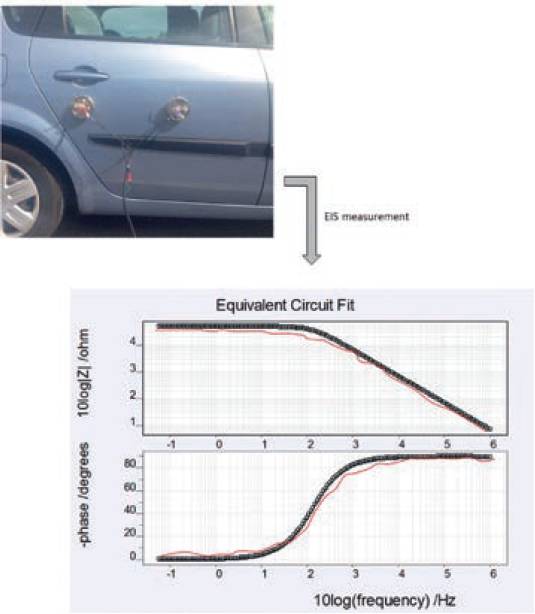
Fig. 14. EIS measurement of automotive coating taken by using PEC and standard electrochemical cell (red trend).
B. Example 2 – Hazardous compartment coating
In the second example, PECs were installed on a hazardous compartment. Two-stage analyses were performed in which the defect in coating was detected by using Tafel measurement in stage 1 and then the coating condition was identified in stage 2 by using EIS measurement as shown in Fig. 15.
The stage 2 measurement showed a low pore resistance R2 (3.015 E+02) which indicates that the coating was defected but at the same time it also showed a high coating capacitance C1 (9.845 E-08) which pointed out that the defect was not significant and the overall condition of coating was good. If both C1 and R2 would have been simultaneously low, then this would have been an indication of a degraded coating.
C. Example 3 – Overhead pedestrian bridge coating
PECs were installed on an overhead bridge to measure the condition of coating as shown in Fig. 16. Visual inspection showed that the coating of the bridge was significantly damaged. Non-destructive EIS measurement was performed to calculate the parametric values of equivalent circuit which showed considerable low pore resistance R2 (4.062 E+02) and high coating capacitance C1 (4.604 E-06).
The results clearly showed that the coating of the overhead bridge was significantly degraded as both pore resistance R2 (4.062 E+02) and coating capacitance C1 (4.229 E-04) were low.
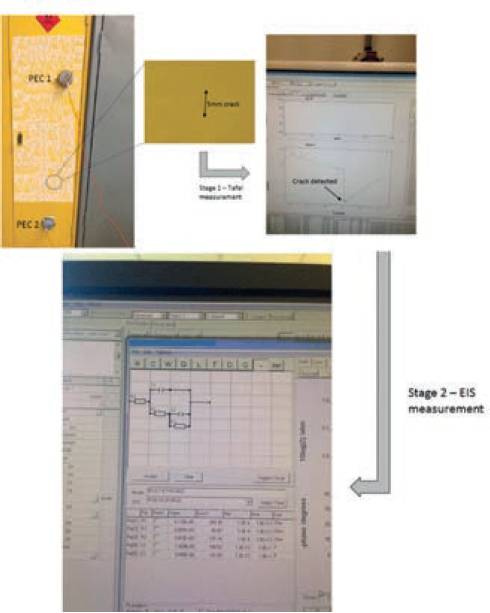
Fig. 15. Tafel scanning performed by using PEC to detect the invisible crack on hazardous compartment coating (Stage 1). EIS measurement is used for calculating the parametric values of the equivalent circuit (Stage 2).
Conclusion
Electrochemical measurements by using custom-developed cells are easy, reliable and flexible in terms of on-site field location. This technology can find its application in automotive workshops, aerospace workshops, industry, and research departments, where onsite field corrosion monitoring is a major challenge.
This paper presents the development of low-cost, portable and non-destructive electrochemical cell which can be used to assess the quality of coatings.
This cell, unlike conventional electrochemical cell, is portable with magnetic body and because of its completely sealed design it can be attached to any horizontal, vertical and upside-down coated metal objects, structures and systems such as steel beams, walls and ceilings, bridges, aircraft, automobiles and locomotives.
In this way the object constitutes the bottom of the cell. The cell can be filled with the electrolyte by using an inlet tube.
A combination of two cells can be used for the non-destructive testing of coating with one cell forming the counter electrode while the other forming the working electrode.
Such combination develops a close path for the current flow through coating and metal substrate between the two cells.
This cell combination facilitates a variety of corrosion measurements (such as Tafel and EIS) to determine the quality of coating where direct access to the metal substrate is not possible.
The Tafel measurement is facilitated to detect the micro-defects in coating and to measure the corrosion rate of underlying metal substrate. The EIS measurement is facilitated to measure the corrosion-resistant properties of coating.
Electrochemical measurements by using custom-developed cells are easy, reliable and flexible in terms of on-site field location. This technology can find its application in automotive workshops, aerospace workshops, industry, and research departments, where onsite field corrosion monitoring is a major challenge.
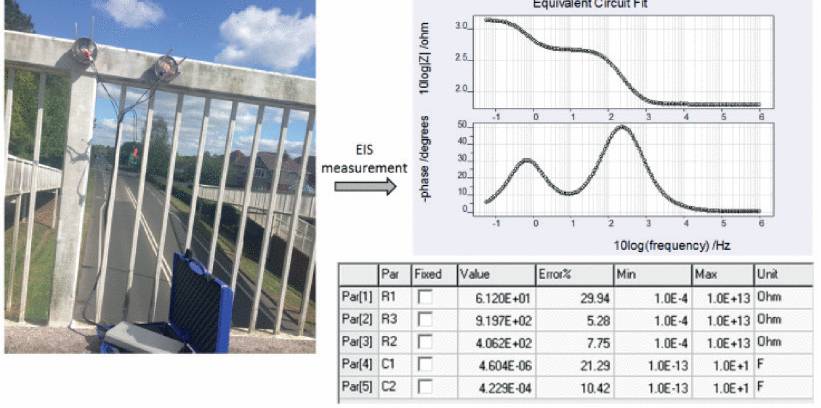
Fig. 16. EIS measurement and result of overhead pedestrian bridge coating taken by using PEC.
Mian Hammad Nazir, and Zulfiqar A. Khan, Bournemouth University, and Adil Saeed, Global College of Engineering and Technology, Muscat, Oman
Reprinted with kind permission of the authors
---
1 Weldon, DG. Failure Analysis of Paints and Coatings. Hoboken, NJ, USA: Wiley, 2009.
2 Samadzadeh, M., Boura, SH., Peikari, M., Kasiriha, SM., and Ashrafi, A. ‘A review on self-healing coatings based on micro/nano capsules’, Prog. Organic Coat., vol. 68, pp. 159–164, Jul. 2010.
3 Wang, G., Liaw, PK., Senkov, ON., Miracle, DB., and Morrison, ML. ‘Mechanical and fatigue behaviour of Ca65Mg15Zn20 bulk-metallic glass’, Adv. Eng. Mater., vol. 11, pp. 27–34, Jan. 2009.
4 Ernst, P., Wadsworth, IP., and Marshall, GW. ‘Porosity of electroless nickel coatings investigated using different porosity tests and their application’, Trans. Inst. Metal Finishing, vol. 75, no. 5, pp. 194–198, 1997.
5 Leisner, P., and Benzon, ME. ‘Porosity measurements on coatings’, Trans. Inst. Metal Finishing, vol. 75, no. 2, pp. 88–92, 1997.
6 Kerr, C., Barker, D., and Walsh, F. Electrochemical Techniques for the Evaluation of Porosity and Corrosion Rate for Electroless Nickel Deposits on Steel. Houston, TX, USA: NACE, 1997.
7 Celis, JP., Roos, JR., and Fan, C. ‘Porosity of electrolytic nickel-phosphorus coatings’, Trans. Inst. Metal Finishing, vol. 69, pp. 15–19, May 1991.
8 McCafferty, E. ‘Validation of corrosion rates measured by the Tafel extrapolation method’, Corrosion Sci., vol. 47, no. 12, pp. 3202–3215, 2005.
9 Kissinger, PT., and Heineman, WR. ‘Cyclic voltammetry’, J. Chem. Edu., vol. 60, no. 9, p. 702, 1983.
10 Oldham, KB., and Mansfeld, F. ‘On the so-called linear polarisation method for measurement of corrosion rates’, Corrosion, vol. 27, no. 10, pp. 434–435, 1971. [Online]. Available: http://www.corrosionjournal.org/doi/abs/10.5006/0010-9312-27.10.434?code=nace-prem-site
11 Wessling, B. ‘Passivation of metals by coating with polyaniline: Corrosion potential shift and morphological changes’, Adv. Mater., vol. 6, no. 3, pp. 226–228, 1994.
12 Zhang, J., and Desai, V. ‘Evaluation of thickness, porosity and pore shape of plasma sprayed TBC by electrochemical impedance spectroscopy’, Surf. Coat. Technol., vol. 190, pp. 98–109, Jan. 2005.
13 Ahn, SH., Lee, JH., Kim, HG., and Kim, JG., ‘A study on the quantitative determination of through-coating porosity in PVD-grown coatings’, Appl. Surf. Sci., vol. 233, pp. 105–114, Jun. 2004.
14 Creus, J., Mazille, H., and Idrissi, H. ‘Porosity evaluation of protective coatings onto steel, through electrochemical techniques’, Surf. Coat. Technol., vol. 130, pp. 224–232, Aug. 2000.
15 Sawyer, DT., Sobkowiak, A., and Roberts, JL. Electrochemistry for Chemists. Hoboken, NJ, USA: Wiley, 1995.
16 Mansfeld, F. ‘Use of electrochemical impedance spectroscopy for the study of corrosion protection by polymer coatings’, J. Appl. Electrochem., vol. 25, no. 3, pp. 187–202, 1995.
17 McIntyre, JM., and Pham, HQ. ‘Electrochemical impedance spectroscopy; a tool for organic coatings optimisations,’ Prog. Organic Coat., vol. 27, pp. 201–207, Jan./Apr. 1996.
18 Olivier, M-G. and Poelman, M. ‘Use of electrochemical impedance spectroscopy (EIS) for the evaluation of electrocoating’s performances’, in Recent Researches in Corrosion Evaluation and Protection. Rijeka, Croatia: INTECH Open Access Publisher, 2012.
19 González-García, Y., González, S., and Souto, RM. ‘Electrochemical and structural properties of a polyurethane coating on steel substrates for corrosion protection’, Corrosion Sci., vol. 49, no. 9, pp. 3514–3526, 2007.
20 ‘Basic overview of the working principle of a potentiostat/galvanostat (PGSTAT)—Electrochemical cell setup’, Metrohm Autolab. BV, Utrecht, The Netherlands, Autolab Appl. Note AAN EC08, 2011, pp. 1–3.
21 Saeed, A., Khan, ZA., and Montgomery, EL. ‘Corrosion damage analysis and material characterisation of Sherman and Centaur—The historic military tanks’, Mater. Perform. Characterisation, vol. 2, pp. 30–44, Feb. 2013.
22 Saeed, A., Khan, ZA., Hadfield, M., and Davies, S. ‘Material characterisation and real-time wear evaluation of pistons and cylinder liners of the tiger 131 military tank’, Tribol. Trans., vol. 56, no. 4, pp. 637–644, 2013.
23 Nazir, MH., Khan, ZA., Saeed, A., and Stokes, K. ‘A model for cathodic blister growth in coating degradation using mesomechanics approach’, Mater. Corrosion, vol. 67, no. 5, pp. 495–503, 2015.
24 Nazir, MH., Khan, ZA., Saeed, A., and Stokes, K. ‘Modelling the effect of residual and diffusion-induced stresses on corrosion at the interface of coating and substrate’, Corrosion, vol. 72, no. 4, pp. 500–517, Apr. 2016.
25 Saeed, A., Khan, Z., Clark, M., Nel, N., and Smith, R. ‘Non-destructive material characterisation and material loss evaluation in large historic military vehicles’, Insight, Non-Destruct. Test. Condition Monitor., vol. 53, no. 7, pp. 382–386, 2011.
26 Nazir, MH., Khan, ZA., Saeed, A., and Stokes, K. ‘A predictive model for life assessment of automotive exhaust mufflers subject to internal corrosion failure due to exhaust gas condensation’, Eng. Failure Anal., vol. 63, pp. 43–60, May 2016.
27 Saeed, A. ‘Sustainable methodology of conserving historic military vehicles’, PhD dissertation, Faculty Sci. Technol., Bournemouth Univ., Poole, U.K., 2013.
28 Saeed, A., Khan, ZA., and Nazir, MH. ‘Time dependent surface corrosion analysis and modelling of automotive steel under a simplistic model of variations in environmental parameters’, Mater. Chem. Phys., vol. 178, pp. 65–73, Aug. 2016.
29 Nazir, MH., Khan, ZA., and Stokes, K. ‘A holistic mathematical modelling and simulation for cathodic delamination mechanism—A novel and an efficient approach’, J. Adhes. Sci. Technol., vol. 29, no. 22, pp. 2475–2513, 2015.
30 Khan, ZA., Grover, M., and Nazir, MH. ‘The implications of wet and dry turning on the surface quality of EN8 steel’, in Transactions on Engineering Technologies. Dordrecht, The Netherlands: Springer, 2015, pp. 413–423.
31 Nazir, MH., Khan, ZA., and Stokes, K. ‘Modelling of metal-coating delamination incorporating variable environmental parameters’, J. Adhes. Sci. Technol., vol. 29, no. 5, pp. 392–423, 2014.
32 Nazir, MH., Khan, ZA., and Stokes, K. ‘Optimisation of interface roughness and coating thickness to maximise coating-substrate adhesion – A failure prediction and reliability assessment modelling’, J. Adhes. Sci. Technol., vol. 29, no. 14, pp. 1415–1445, 2015.
33 Nazir, M., Khan, ZA., and Stokes, K. ‘A unified mathematical modelling and simulation for cathodic blistering mechanism incorporating diffusion and fracture mechanics concepts’, J. Adhes. Sci. Technol., vol. 29, no. 12, pp. 1200–1228, 2015.
34 Nazir, MH., Khan, ZA., and Stokes, K. ‘Analysing the coupled effects of compressive and diffusion induced stresses on the nucleation and propagation of circular coating blisters in the presence of micro-cracks’, Eng. Failure Anal., vol. 70, pp. 1–15, Dec. 2016.
35 Luo, H., Rai, BK., Mishra, SR., Nguyen, VV. and Liu, JP. ‘Physical and magnetic properties of highly aluminium doped strontium ferrite nanoparticles prepared by auto-combustion route’, J. Magn. Magn. Mater., vol. 324, no. 17, pp. 2602–2608, 2012.
36 Hirschorn, B., Orazem, ME., Tribollet, B.,Vivier, V., Frateur, I., and Musiani, M., ‘Determination of effective capacitance and film thickness from constant-phase-element parameters’, Electrochim. Acta, vol. 55, no. 21, pp. 6218–6227, 2010.
37 Talo, A., Passiniemi, P., Forsén, O., and Yläsaari, S. ‘Polyaniline/epoxy coatings with good anti-corrosion properties’, Synth. Metals, vol. 85, pp. 1333–1334, Mar. 1997.
38 Langford, P. and Broomfield, J. Monitoring the Corrosion of Reinforcing Steel (Construction Repair), vol. 1. Farnham, UK: Palladian, 1987.