The transition from risk to prevention
Markus Rennen, Senceive
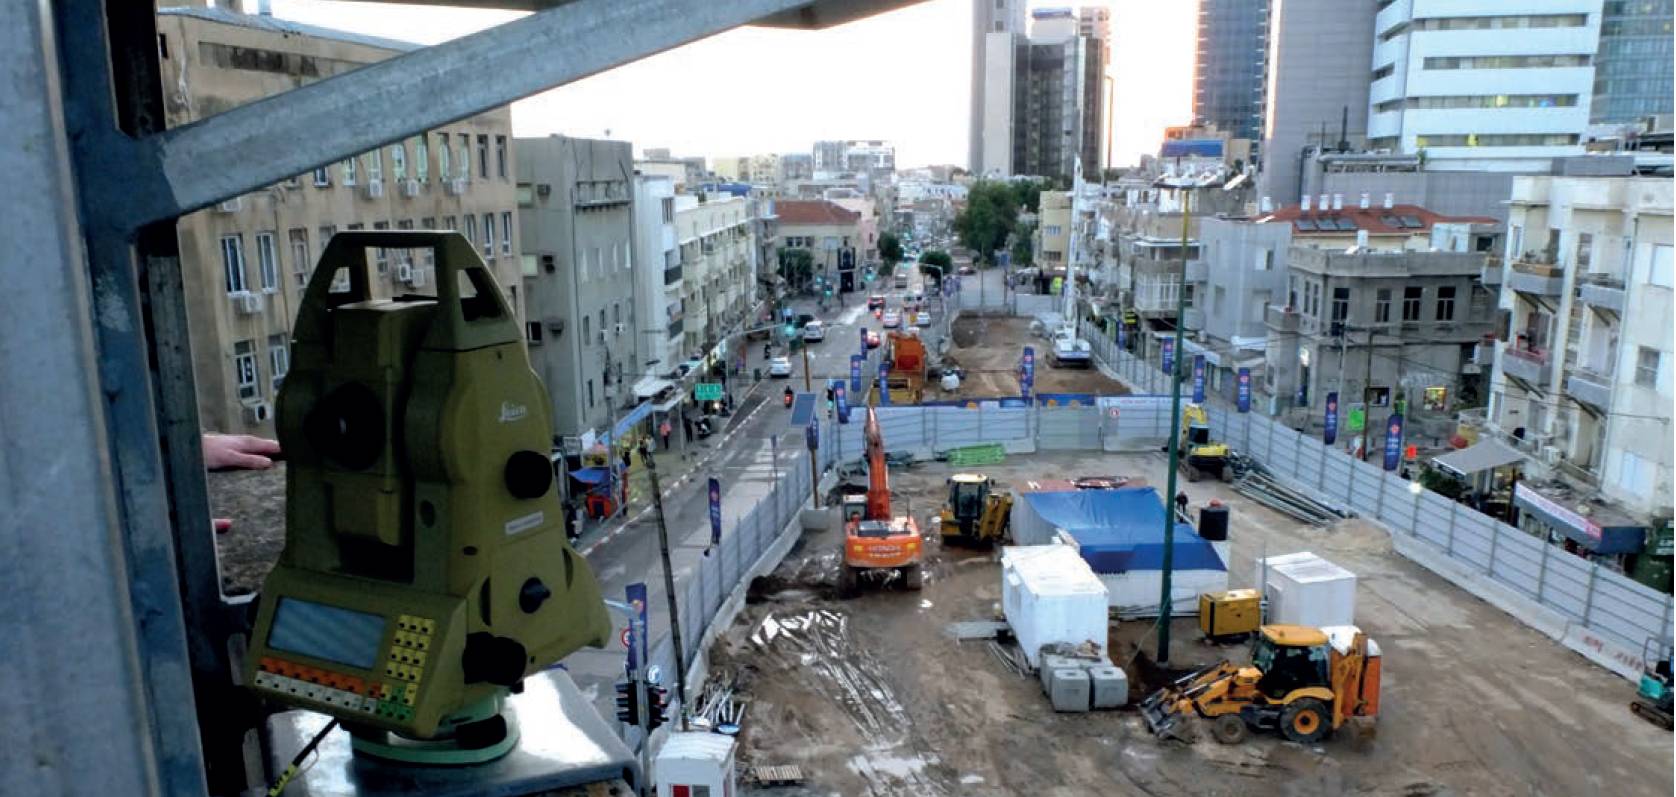
Fig.2: View from an automated total station onto a construction site.
“HOPE is not an engineering tool”. Quoting an unknown author summarises the necessity of monitoring. While hope might be defined as a rough estimation of the absence of disturbing events, risk might be defined as the probability of an undesirable event due to activity or neglect.
For a monitoring programme to enable a thorough evaluation of risk it should deliver data on parameters including threshold values, speed of occurrence and of course the severity of the event.
Consideration of the latter in particular defines whether monitoring seems efficient compared to accepting the consequences of a failure. Those consequences could range from financial loss or project delay to injury or loss of life.
Whether investment in monitoring pays off will depend on the severity of the risk event balanced against the cost and effort required to implement the monitoring programme (Fig. 1).
It is therefore important to seek ways to lower the cost and simplify the process. Automation can be considered one of the main levers to control cost, particularly where frequent reporting is required, where access to the area of observation is limited, difficult or even dangerous, or where the observation is needed over a long duration. Key considerations are the level and predictability of running costs, the need for maintenance, and system reliability.
Whereas manual surveys provide the opportunity to react spontaneously, automation requires a degree of foresight. It also requires confidence that the automated system is sufficiently smart to monitor the health of itself and the assets it is observing.
Only when that confidence exists can the user sleep tight with confidence that their virtual watchdog is keeping an eye open for them. The first steps in this journey involved the automation of traditional (mostly optical) geodetic observation tools such as total stations.
Advantages include the low cost of passive targets and the ability to translate one-dimensional coordinate differences to reveal absolute displacement in the three-dimensional space.
Disadvantages include reliance on line-of-sight to reflective prisms which can be obstructed in the short or long-term by construction machinery, dust, snow or condensation (see example Fig. 2).
Prisms and other equipment such as cables required for communication or power supply could be damaged or destroyed by construction activity.
A further constraint is that systems reliant on passive sensors provide data only at the pre-determined time at which a measurement is taken – they are unable to react to changing conditions, for example by accelerating their sampling regime.
Many of these shortcomings can be overcome by the use of active optical and mechanical sensors using wireless technology.
Wireless techniques
Principles
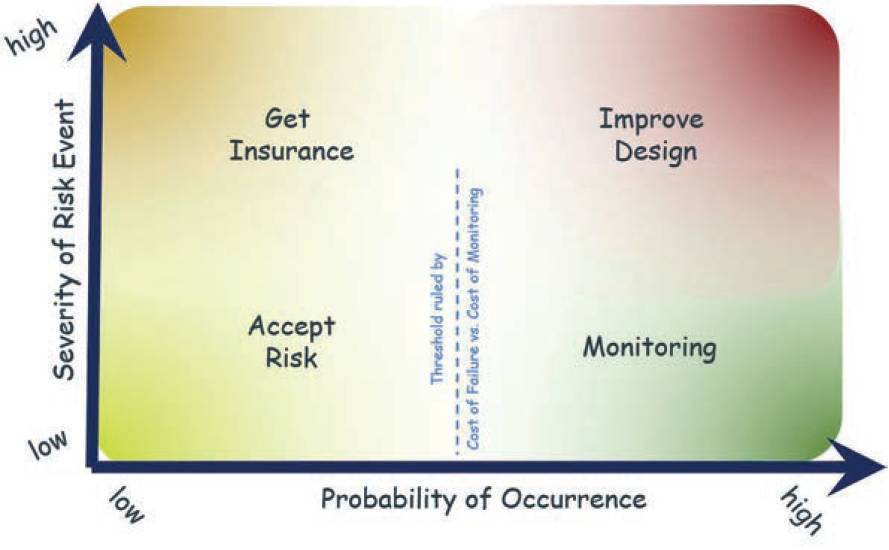
Fig.1: Estimation of the economic efficiency of monitoring.
Alternatives came into sight with miniaturisation, specifically the advent of micro-electro-mechanical systems (MEMS1 ) techniques. The availability of very small sensor components with low power consumption has allowed the combination of sensor, communication and power supply in a single compact housing, referred to as a node. The node is self-sustaining and autonomous and as such forms the primary component of a wireless condition monitoring (WCM) system.
A notable example of a fully integrated sensor species is the tilt node. With 3-axe inclinometers providing 360° measurement range the user can choose to deploy the node at any orientation with no need for pre-levelling.
Very low power consumption (more than 12 years at 30min recording intervals) enables long-term structural health monitoring and efficient measurement in locations that are hard to reach. It also enables the re-use of sensors on multiple projects. Wireless nodes can transmit data from their own built-in sensors (e.g. triaxial tilt sensors), and can also be connected to various external sensors.
Conventional geotechnical devices, such as potentiometric crack sensors or vibrating wire strain gauges or piezometers from various manufacturers can be combined to form a multi-sensor system reporting within one platform.
Fig. 3 shows an example for the monitoring of a historic façade utilising various sensors including tilt nodes and crack sensors connected to a single wireless communication platform. Alternatively, a cluster of identical sensors can be connected to a multi-channel communication node (Fig. 4).
Where distances exceed the range of mechanical devices like the above potentiometric or draw wire sensors, or where the location does not allow a physical connection, integrated laser distance sensors can help to detect 1D displacements (Fig. 5).
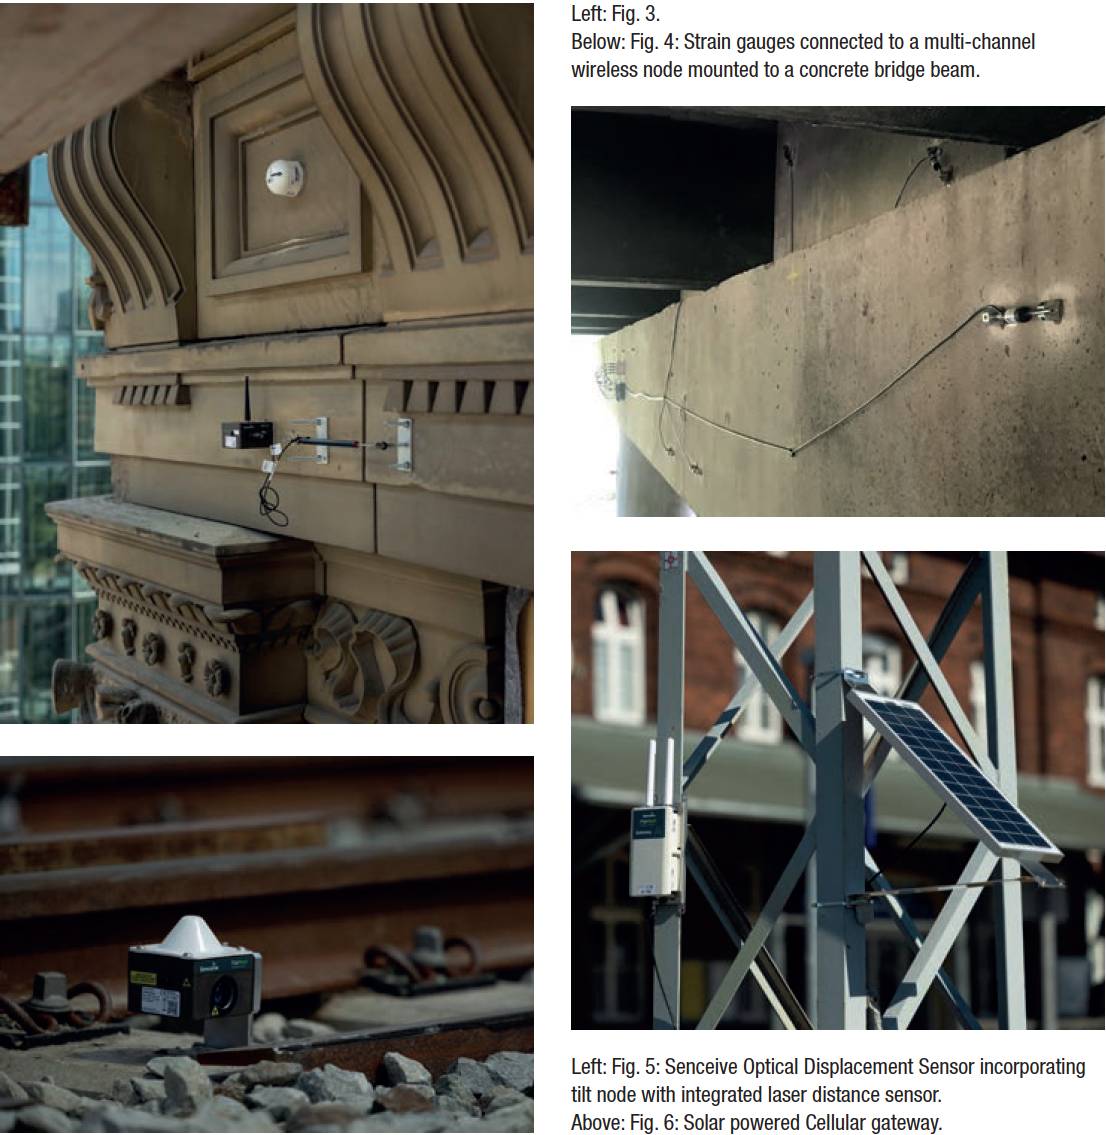
A gateway device gathers the data, stores it and in most cases transmits it via cellular modem to a cloud-based data visualisation platform (Fig. 6).
In most cases the gateway is solar-powered, thus enabling the use of wireless monitoring at locations that have neither fixed power nor communications infrastructure.
The two most widely used communications platforms are a high-frequency mesh-based platform using the 2.4GHz Wi-Fi frequency, and a lower frequency point-to-point LoRaWAN system operating at 868MHz2. The longer wavelength of the latter system provides long-range transmission directly from the node to the gateway over distances of several kilometres and penetration through physical obstacles.
Pay-offs include issues related to legal limitations of signal occupation and constraints in recording rate and two-way communication due to the low bandwidth.
Furthermore, LoRa users occasionally experience overlapping by ambient signals and thus must accept a certain amount of so-called package loss.
With its shorter wavelength, the 2.4GHz provides a much higher bandwidth, albeit at the expense of reduced range, which is limited to a few hundred metres under best conditions, and more typically to a few tens of metres. Wide areas can still be covered however because nodes can be configured to form extended clusters. Significant advantages of platforms such as Senceive FlatMesh include faster (sub-minute) reporting rates and much greater interaction with the monitoring system by remote users.
The other key element of a wireless monitoring system is usually a cloud-based data portal and visualisation platform that provides user access, preliminary data processing and alarming based on user-defined threshold values.
Examples and Evaluation
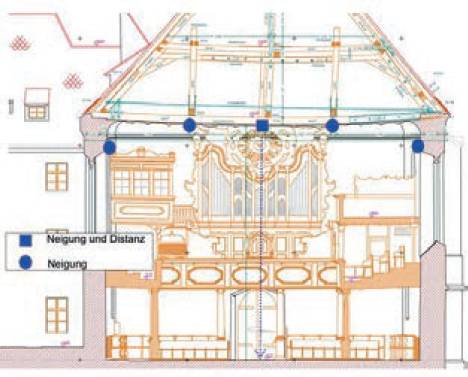
Fig. 7: Constellation of the WCM observation during the renovation of a historic church’s roof truss [Janka P.].
Wireless condition monitoring (WCM) provides engineers, surveyors and owners with a wide range of functionality and typically requires less expertise to install and operate than traditional wired or geodetic techniques. Installation can be performed by non-experts, often with remote support where required. This facilitates the use of WCM for spontaneous tasks and for small assignments where costs are far lower than observations using automated total stations (ATS).
Very low power consumption (more than 12 years at 30 mins recording interval) enables long-term structural health monitoring and efficient measurement in locations that are hard to reach.
Compared to manual observations there is an immense gain in terms of increased spatial and temporal sampling – more data means more detail. Fig. 8 shows the comparison of occasional manual crack sensor observations vs a continuously operating WCM crack sensor on the wing walls of a weir in Austria.
Though the graphs coincide where data is available, it is obvious that the high-frequency WCM observations reveal short-term structural behaviour that is missed by less frequent sampling of the manual operation.
Fig. 7 shows the WCM constellation during the truss renovation of the baroque St. Oswald church in Regensburg, Germany [Janka P.]. Paired tilt nodes were installed on the roof beams in order to determine whether beam movement took the form of tilt (if the direction of tilt is directed equally), or bending (if tilt points in the opposite direction).
A bending motion would be characterised by vertical displacement with no tilt at the centre. To determine if this was the case the tilt nodes were supplemented by the use of optical displacement sensors installed at the centre of the beams pointing down to the floor.
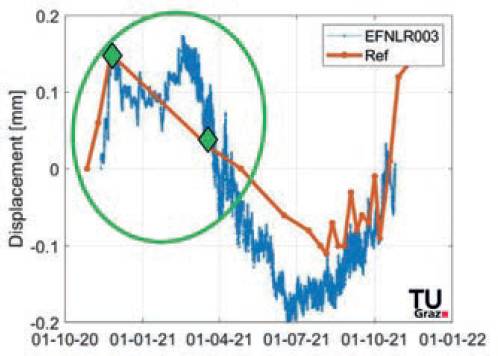
Fig 8.: Manual crack observation (red) vs. automated crack Sensor time series (blue) (Kaden B., Kalenjuk S.)
The data presented in Fig. 9 shows the individual parameters indicated by colour-coded alarm levels.
In Fig. 10 the time series of the tilt sensors, as well as the ambient temperature, is shown over an 18-month period. A correlation between temperature and movement is apparent, despite the relatively stable thermal environment inside the church.
Furthermore, it is apparent that the walls moved less than the beams which provided confidence that the data indicates deformation of the beams rather than extraneous temperature effects on the sensors. The data also displayed a correlation between construction activity and structural behaviour throughout the monitoring programme.
The higher sampling frequency of WCM is often more effective for the measurement of relative movement than traditional geodetic surveys, although the latter will typically deliver more precision in terms of absolute measurement. There are therefore many situations where wireless monitoring can complement manual geodetic surveys rather than provide an alternative.
A common approach is to conduct an initial geodetic survey, which can include the precise positioning of bolts or targets fixed to the structure.
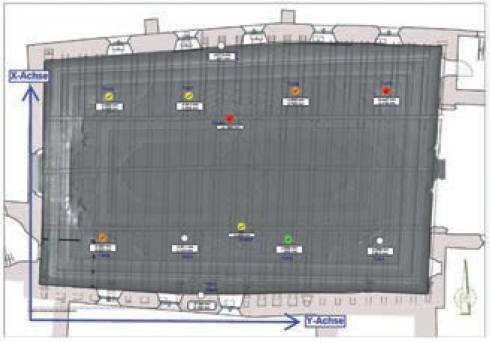
Fig. 9: Data visualisation platform of church roof truss observation.
Subsequent WCM observations can characterise typical behaviour patterns, with any alarms triggered by the WCM followed up in a pre-determined way, which will often include verification by an independent survey.
Usually, activity-induced deformation differs significantly from typical behaviour (Fig. 11).
Where two elements of interest are physically separated (such as a pair of bridge piers) the use of 1D laser distance observations can be conducted using devices such as the Senceive Optical Displacement Sensor. These measurements are often conducted reflectorless straight onto the observed surface.
Repeatability roughly equals those given for common total stations (±0.1mm), though achievable practical results depend on environmental conditions, surface structure and, of course, distance. With increasing distance the influence of refraction and visibility becomes greater.
Even at long distances (>100m) however, accuracies in the few millimetre range are realistic as the time series excerpt in Fig. 12 shows for the observation of the distance between two bridge pillars.
Further Applications
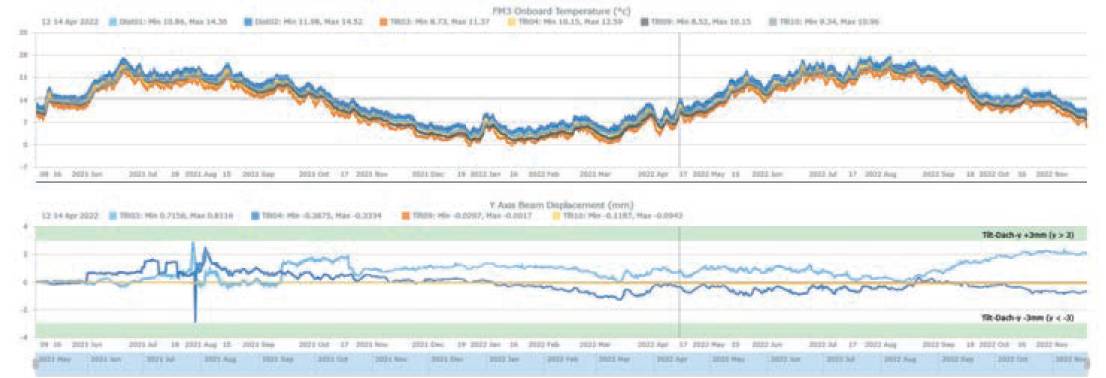
Fig. 10: Time series of selected tilt sensors (truss beams: Blue; wall: Orange/Yellow).
It is quite common for monitoring to be required due to the influence of construction activity adjacent to existing buildings and structures.
Typical examples include bridges, facades, sheet pile and retaining walls. In the case of the façade shown in Fig. 3 the use of ATS observations was prevented by extensive scaffolding which blocked the line of sight between the total station and geodetic prism targets. An initial baseline survey was carried out manually. During demolition of the building core the remaining façade was observed using various wireless sensors.
The system was configured so that breaches of threshold values defined by the designers would trigger alarms and further manual surveys would be initiated.
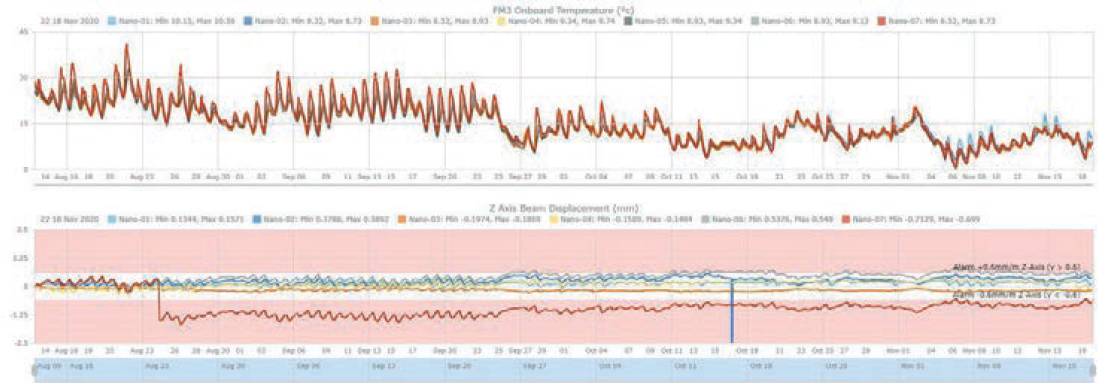
Fig. 11: Observation of pillars by tilt sensors. Temperature-related diurnal signal vs. significant deviation in case of physical impact (red graph).
The ultra-long battery life of wireless nodes enables the assessment of long-term behaviour trends such as those related to changing seasonal conditions. Dams and reservoir retaining walls, for example, may experience changing loads due to seasonal changes in water level, causing deformation, stress or even cracks. Bridges can suffer from increasing traffic load and from the effects of temperature and material deterioration.
Data from wireless tilt nodes, strain gauges and dedicated temperature sensors can provide valuable insight that enables scarce maintenance resources to be effectively targeted.
During the renovation of the Spanish Martorell tunnel as part of the Mediterranean Rail Corridor project the invert of the tunnel was lowered and thus the tunnel height extended in order to allow future electrification. Designers expected this to result in deformation during the works and specified a monitoring programme to provide near real-time data on parameters including convergence of the lining.
Arrays of optical displacement sensors were installed at regular intervals around the arch to monitor convergence, and longitudinal chains of tilt beams were installed along the tunnel walls to monitor vertical displacements (Fig. 10).
Ease of installation is particularly significant when time is limited. Time is almost always limited when rail track monitoring is required, and returning to site for subsequent measurements or interaction with a monitoring system is expensive and complicated. Further challenges include the presence of obstructions such as masts, platforms, trains etc. that can complicate optical observations.
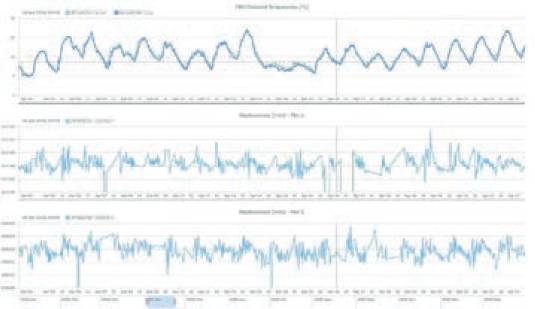
Fig. 12: Example for real-life repeatability of automated distance observations at distances > 130m.
The option to utilise tilt sensors for rail track geometry monitoring has been documented in the past (e.g. Golser J.), but it is only since tilt sensors became wireless that the use of these methods become realistic, sustainable and reliable. Rail and sleeper are considered as an interconnected unit, with the sleepers treated as rigid.
Multi-axial tilt sensors observe lateral and longitudinal tilt simultaneously. Lateral tilt reveals changes in cant (cross-level), while the differences in consecutive lateral tilts show track twist.
Because the sleepers are connected by the rails it is possible to model virtual sensor chains longitudinally to provide indicative measurement of settlement. While this does not provide spirit-level accuracies it represents a perfect compromise between the logistic constraints of ATS observations (interference with traffic, limited sampling etc..). Often both systems supplement each other and in synergy offer the best of best worlds.
In many cases the quantitative magnitude of movement is less significant than the identification of events that are outside normal behaviour patterns. This is relevant in various structural and geotechnical applications, including the study of slopes and embankments. In their study of slope monitoring using tilt sensors Uchimura T. demonstrated the value of tilt sensors in the prediction of slope failure.
The authors not only pointed out the general usability but also evaluated the reliability of the prediction depending on the location of the nodes. Because earthworks such as embankments and cuttings extend over long distances and are especially difficult to observe in remote locations the autonomous operation of a WCM system proves to be specifically advantageous.
With over 30,000 wireless sensors installed on railway earthworks worldwide the methodology can be regarded as well-established and proven.
Since 2019 rail operators have been able to deploy responsive wireless systems such as the Infraguard solution developed by Senceive to provide early warning of potentially disruptive and dangerous slope failures.
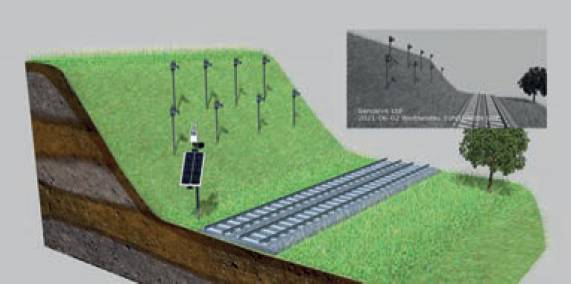
Fig. 13: InfraGuard system including tilt nodes, camera and cellular gateway.
In a typical deployment rows of tilt nodes are mounted on metal stakes (Fig. 13).
Such systems are only effective if they can operate for long periods with minimal maintenance. This is made possible partly by improvements in battery performance, but more significantly by the network intelligence built into each node: this allows it operate in a semi-dormant mode for most its life, but to ‘wake-up’ in the event of significant ground movement.
Not only does such an event activate neighbouring tilt nodes to send updates, but also triggers cellular cameras to take and send photos of the site – enabling remote stakeholders to verify the significance of an event before they can get people to site.
Conclusion
Automated monitoring provides near-continuous information regarding the condition of infrastructure. Wireless condition monitoring (WCM) provides extreme versatility by integrating various geometric or geotechnical sensors and combining them to form a single multi-sensor system.
Because WCM provides different parameters or some parameters differently a re-think of monitoring is required. The technology should not necessarily be seen as challenging classic observation techniques, but instead as way to address some of their most significant constraints.
As long ago as the 1960s Peck R.B. promoted the observational method, i.e. the reiterating interaction of observations, evaluation of its results and permanent adjustment of design and procedure.
Advances in monitoring technology and practice fundamentally support the safe and efficient use of these principles through provision of comprehensive, precise and timely data.
The simplicity of WCM installation, operation, and maintenance has made monitoring much more accessible whether projects are big, small, temporary or permanent. Accepting risk has become less acceptable, reliance on hope is not an option anymore.
Markus Rennen, Senceive
References
Golser J. (2010) ‘Fallbeispiele zur Bauwerksüberwachung mittels Online Neigungsmessung’; in 25. Christian Veder Kolloquium, Vortrag 9.4.2010 Graz
Janka P.; Janka Ingenieurbüro für Vermessung und Geoinformation. 92421 Schwandorf, Deutschland
Kaden B., Kalenjuk S. (Rennen N M.) (2022), Vortrag ‘Bauwerksmonitoring mit Senceive-Neigungssensoren Landpfeiler Verbund-Flusskraftwerk’ Geodätisches Kolloquium Universität Innsbruck 16.03.2022, Innsbruck, Austria
Kalenjuk S., Lienhart W. (2020), Vortrag ‘Performance of Senceive Triaxial Tilt Sensor Nodes - Insights from lab tests and a field study’ Geodätisches Kolloquium Universität Graz 07.10.2020, Graz, Austria
Peck, RB. (1969) ‘Advantages and Limitations of the Observational Method in Applied Soil Mechanics’ 1969, Géotechnique, pp 171-187, V 19, N 2, 10.1680/geot.1969.19.2.171
Uchimura T. Et al. (2020) ‘Precaution and early warning of surface failure of slopes using tilt sensors’; in, ‘Soils and Foundations’, Vol.55 Issue 5, Oct.2015 P.1086-1099 The Japanese Geotechnical Society/Elsevier
---
1 Micro Electronic Mechanical Sensor
2 868MHz for EU, other frequencies depending on region, see https://lora-alliance.org