
A MACHINE LEARNING JOURNEY
The strength of – and limits to – machine learning and how the industry can utilise it
A couple of years ago, I was asked by the NW region of CICES if I wanted to give a presentation on Applications in Cadd (AIC) – where we came from, what we were currently working on, plus where I saw our software going in the future. Luckily, six months prior, a then junior member of staff (Isaac Russell) had been playing around with some machine learning tools in his spare time. He had come to me and showed that with only some basic training, he was able to detect certain objects in images. Specifically, road markings in this instance. I was hooked! So, thanks to Isaac, I was able to end that first presentation with a few examples of our first foray into machine learning.
Here, I think it is a good time to explain what we mean by machine learning (ML) and artificial intelligence (AI). What we and lots of other software houses are trying to do is leverage ML tools to train a system or model, to segment, classify and/or recognise features. To ascertain relationships, define concepts and spot patterns with a dataset of some kind. Some of the more advanced systems can then go on to generate content and are trained on databases taking up many petabytes of storage. Such systems are more commonly known as large language models (LLMs), something we will come onto shortly.
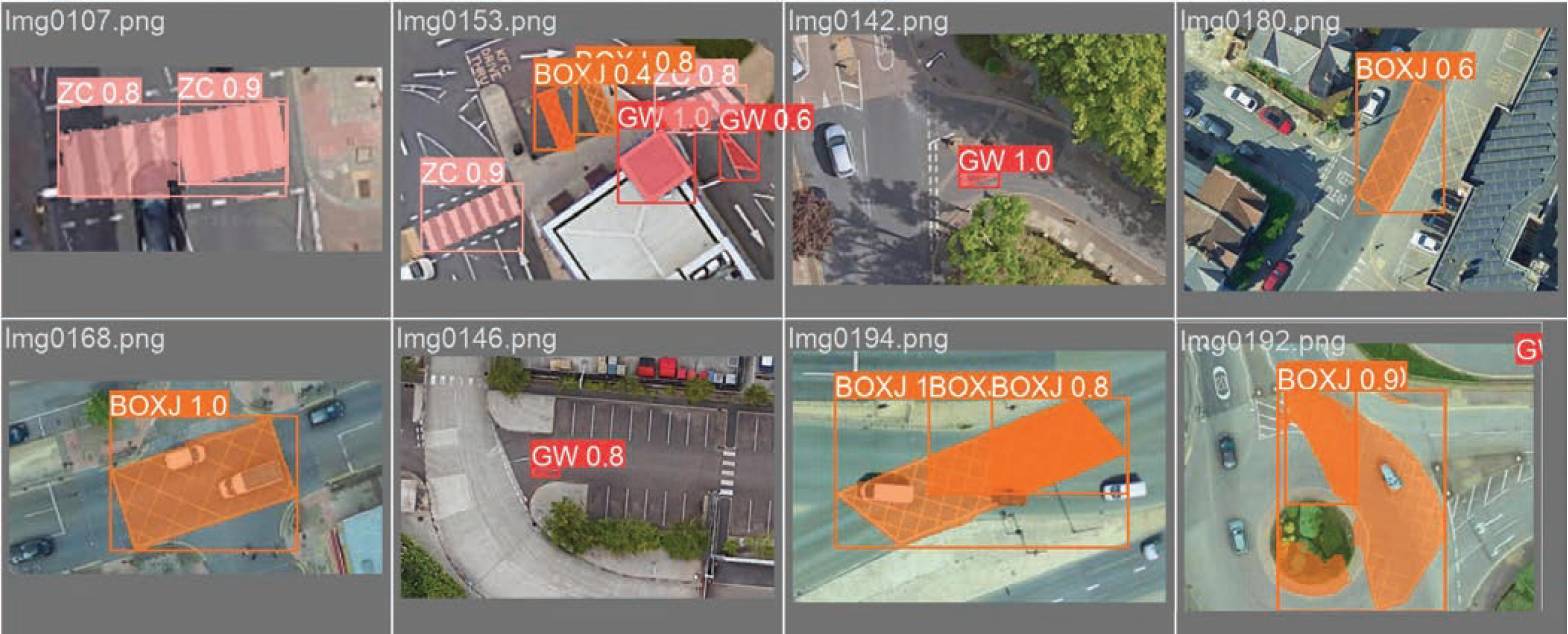
For now though, I would like to wind the clock back to the end of that last presentation and the slides I showed at that time. This was one of our very early tests. Having harvested thousands of images from Google Earth, we set about teaching the system to recognise give way markings on the road, as well as box junctions. This involved manually drawing around and labelling hundreds of examples of each feature. This data was then fed into the ML system and after a few hours of processing we were very pleased to see the results. On images the system had never seen before, it was able to semi-reliably pick out give way markings and box junctions. In other words, the machine had ‘learned’ the characteristics of these features and was able to make educated statistical predictions as to what it was seeing when it was asked to look at something new. What was really impressive for me was that a curved box junction, which was on a roundabout, was still recognised as a box junction. Not only that, but it had a confidence of 0.9, or 90%. Based on the fact that it had only ever seen rectangular box junctions before, it had made the intellectual leap, or had the intelligence to reason with a high degree of probability, that this was also a box junction. That was when the light really went on in my head and proved that we should put these tools to some more effective use.
We started thinking about ways in which we could start applying the same techniques to automate finding elements within a point cloud. We could then assign predefined symbols to appropriate objects and populate a survey drawing. To this end, we wrote some tools within our n4ce (pronounced ‘n force’ ) software to extract pre-labelled data based on existing survey information. This was detail we manually drew up over point clouds in n4ce. In doing this, we created a pipeline to take any survey drawing made in n4ce from a point cloud and extract survey elements for machine learning purposes.
Convolutional neural networks were designed to work on image data and are programmed to extract detail from an image by first dicing it up, then running each square of data in parallel through a series of filters that look for specific data.
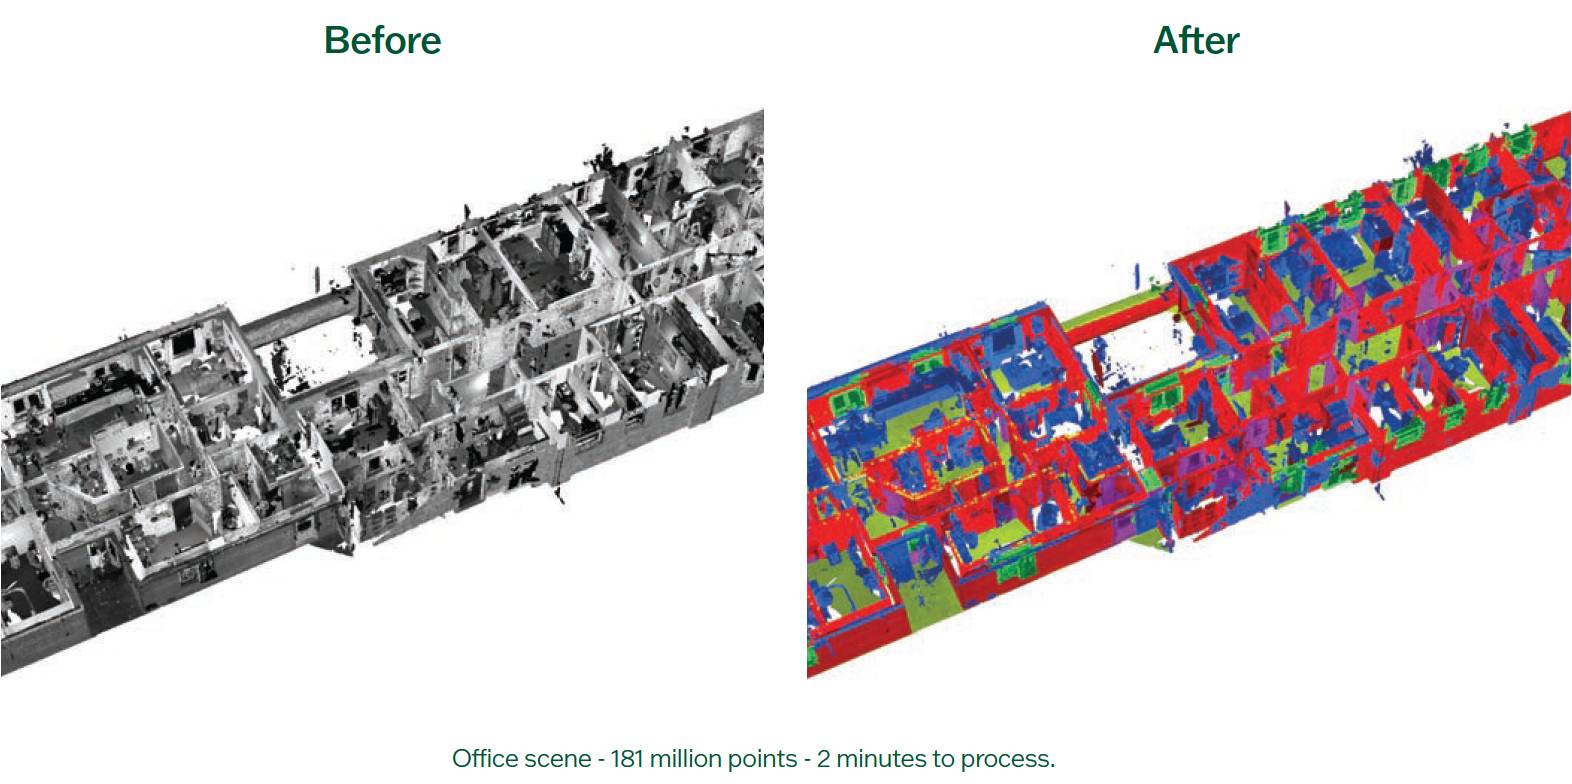
After doing this over many multiple point clouds for various object types, the results were again incredibly positive (pictured, above right). We were spurred on to connect the dots and start work on a pipeline that would allow us to use these techniques commercially. The keen-eyed will notice, however, that this approach is based on images.
Any system based on this approach will be ignoring the true 3D nature of point clouds, which seemed a waste; we needed a way to work on the point cloud data directly, rather than reduce it to 2D detail.

Luckily for us, LLMs were starting to hit the public domain about this time, which used a totally new technique based on what is know as transformers. Before this time, pretty much all machine learning had been based on convolutional neural networks (CNNs). CNNs were designed to work on image data and are programmed to extract detail from an image by first dicing it up, then running each square of data in parallel through a series of filters that look for specific data.
For example, the edge of something, a colour change or pattern of some kind. This information travels through multiple layers, or convolutions, each compressing and extracting more and more detail. Finally, this data is encoded such that it can be learned from in the neural network via a process called back propagation. A statistical model can then be extracted to classify what the image contains. During the training stages, this process is repeated with huge datasets to allow the system to learn the differences between anything that has sufficient volume and metadata to allow the system to incorporate it into its matrix.
If we simplify the notion of vectors to just a 3D space for this example, then the directions and magnitude of these vectors define how the tokens are encoded. Where they appear in 3D space and how they group helps define relationships.
Transformers still divide the data up into chunks, or tokens as they are now called. However, the tokens are assigned huge vectors, which are essentially long lists of numbers, that via a process called attention allow concepts such as context, semantic relationships and rich meaning to be learned, inferred and stored over the entire dataset. Not just on each small part of the data being analysed in isolation.
For a moment, we will assume we are training an LLM. To begin with each word in the passage we are processing is broken up into tokens as shown in the image above. Each token is assigned an initial vector based on a lookup table of all possible tokens. These vectors are just a massive list of numbers that later on will be adjusted to encode the meanings of the tokens, and also the relationships between a token and all those around it. This is the beginning of what makes transformers so powerful. The next stage is to encode the context of each token.
Take the example using the word (or token) ‘mole’. To us, a mole can have multiple means, but this can only be established when we have knowledge of the tokens the precede and follow the token. In other words, the context of the surrounding tokens needs to be communicated back to the token mole to properly describe the situation it is being used in.
This is accomplished via the attention process. Another way to think about these lists of numbers is if they were imagined as true vectors, but in a massively higher-dimensional space. The vectors for ChatGPT 3, which are more than four years old now, have more than 12,000 dimensions. The figures for ChatGPT 4, which is far superior, have not been made public but it is estimated to be an order of magnitude larger. If we simplify the notion of vectors to just a 3D space for this example, then the directions and magnitude of these vectors define how the tokens are encoded. Where they appear in 3D space and how they group helps define relationships.
Manual classifying of point cloud data
Encoding
Take the simple example of the encoding of ‘man’ and ‘woman’. If we subtract the vector ‘man’ from ‘woman’ and then add that to the encoding of ‘uncle’ we get close to the meaning of ‘aunt’. So the direction of the vector between ‘man’ and ‘woman’ somehow describes the idea of gender. To the extent that it can be used to calculate the reciprocal relationship from ‘uncle’ to get to ‘aunt’.
We have been able to achieve credible results using the transformer approach on much more modest setups. A point cloud still needs to be tokenised so the system can begin to digest it, but the all-important context between the tokens is still preserved.
If we take this to a more nuanced level, it turns out that the relationship between Germany and Italy can be used to get from Hitler to Mussolini. Therefore, the training process used to encode these terms, and the attention mechanism that tuned these huge lists of numbers (called vectors), was able to learn both a sense of nationality and political ideals. It accomplished this as a vector of some description in higher-dimensional space.
When you consider how many directions are possible with over 12,000 higher dimensions, the scope for LLMs (using transformers) to harvest, store and make accurate predictions, with regards to the input, is phenomenal. The process of training starts with correctly labelled data. Lots and lots of it. The large models from the likes of Google and OpenAI used bots to harvest data from the entire internet, billions of images with metadata, published papers, news articles.
Basically, everything ever written, imaged and publicly available goes into feeding these colossal learning machines. Some of the data is used to teach, some of it is used to check and feedback based on initial predictions. The process of tuning via attention, of the vectors, and then learning via back propagation, is repeated hundreds of times until predictions hopefully align with test data. In machine learning, this is known as minimising the loss functions. When the results have bottomed out, the system can effectively learn no more because there are no appreciable differences over many iterations between predictions and the correct result. In ChatGPT 3 there are over 175 billion adjustable parameters stored in hundreds of giant arrays, these are what store the knowledge that has been learned. This is the scale of systems required to communicate context over vast datasets.
The attention mechanism makes connections over the entirety of the input media, not just over localised zones as with the previous convolutional approach to neural networks. Which is why they are so important for us, when it comes to trying to teach a machine learning system what to make of a three-dimensional point cloud. Context is all-important when trying to decide what some data pertains to. It’s especially important when training systems like this to impart knowledge, not just about an object itself, but also how that item interacts with it’s surroundings.
The type of scanning system also has a huge impact. Objects observed from above in point clouds generated via photogrammetry, for instance, generally look different to those from ground-based systems.
This is what transformers allow us to do. We do not have the computing resources and/or the labelled data to even begin to attempt to train a system on the scale of modern LLMs. But we have been able to achieve credible results using the transformer approach on much more modest setups. A point cloud still needs to be tokenised so the system can begin to digest it, but the all-important context between the tokens is still preserved. In fact, it’s key to understanding the data in the scene.
The approach Isaac took was to start with 3D segmentation and rely solely on the intrinsic geometry of the point cloud. No colour or intensity is required. This methodology means that we are hopefully less sensitive to scan data from any particular mode of capture. As long as the actual data itself is valid in terms of its overall shape and structure, then nothing else really matters. But, just like for most other ML models, the learning stage cannot proceed without a lot of pre-labelled data. There are a number of downloadable point clouds that are already pre-classified, but they are generally quite sparce and not really of the density we see from modern scanners. Plus, we wanted to train on as much data as possible.
But there were inconsistencies between the datasets we were able download. One of the number one rules in training an ML model is the data must be consistent. Just as when teaching small children different types of animals, for instance; you cannot call a cat a dog on the odd occasion. That would introduce conflicts, uncertainty and indecision. The same is very true for ML as well. We therefore started manually labelling any and all client data (with their permission) that we could lay our hands on.
After agreeing on what categories we would use, myself and Isaac set about labelling hundreds of gigabytes of data. However, deciding on which categories to use was not straightforward. For example, a static vehicle looks very different to one that’s moving. Especially if the scanner is moving as well. Cars for instance get stretched out as they pass slowly. At what point does a car go from being a car, to noise. Likewise, lamp posts, lighting columns, traffic lights, telegraph poles and street signs can look similar depending on how close, and at what angle they are scanned. The type of scanning system also has a huge impact. Objects observed from above in point clouds generated via photogrammetry, for instance, generally look different to those from ground-based systems. We therefore decided to group all types of road and street furniture together until such time we have enough examples of each to make definitive distinctions between them.
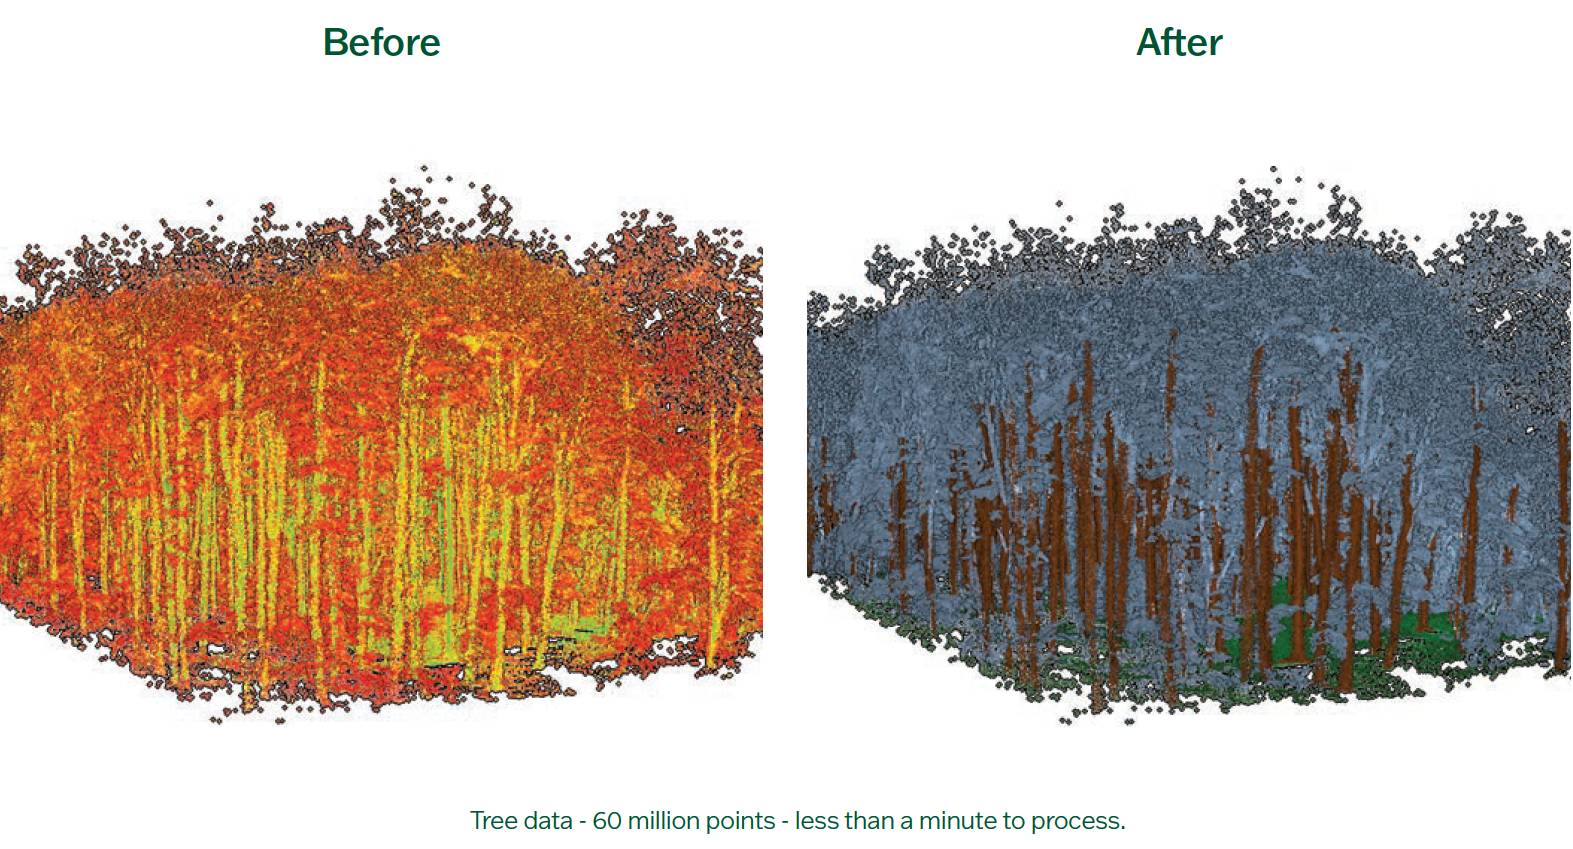
We quickly realised that one ML model for all cases was not a realistic achievement. Internal scans of buildings and office spaces are obviously very different to highways or rail environments. So, it was decided to train four separate models. One for general street scenes and highways, one for internal buildings and office scans, one for rail data, and one to separate tree trunks from their canopies. This meant we could tailor each model to deal with specific use cases. Not having to worry about detail such as floors, windows and doors as unique objects in a scan of a motorway for example, should hopefully mean the final models are more reliable. As opposed to one model that must cover all possible cases no matter what type of data is being fed into it.
To expediate generating the training data, we developed custom tools within our n4ce application to try and make it as simple and as easy as possible to generate labelled data. One approach was to use survey data already drawn up from point clouds, to classify the underlying point data. Surveys processed in n4ce could then be harvested for useful detail because the data was already labelled. We just needed to convert the n4ce survey data, i.e. shapes, symbols and linework into the correct format for machine learning. The classification stage, also known as running inference, uses different colours to represent each different classification. What is hopefully apparent is that while the number of categories is relatively low, the accuracy is high. All of these point clouds were classified on modern hardware, but nothing tremendously high spec.
One of the rewarding things about this type of machine learning is that you can quickly see the improvements over time, as more and more data is used to train the models. The more time you spend training these models, the more they learn, and the more reliable they become. As long as you maintain consistency, and don’t overtrain on a particular data type (so as not to introduce bias), the jumps in productivity between versions is impressive. Therein lies the rub; it is incredibly easy to unwittingly introduce bias without realising it.
To give one prime example – we were putting together a dataset for rail and labelled up many kilometres of data over a number of point clouds. The results were looking good, until we came to one particular test dataset where it really struggled to accurately classify some of the trees and vegetation.
On first inspection the data looked much like any other. Remember, we are not using colour or intensity, so the model is only concerned with the pure geometry of the point cloud.
Then it dawned on Isaac – the trees it was misidentifying were generally in areas on one side of the rails. Looking back through the training data, it became apparent that we had unknowingly taught the system on data that, as luck would have it, predominantly had vegetation on both sides of the rails.
Without realising it, we had skewed our results by not letting the system see enough data... computers and machine learning systems are not all-powerful, they can be just as fallible as us humans.Somehow the system had learned trees are only trees, when they are located on both sides of the rails. This seems silly to us, but when you think back over the transformer approach previously described, it begins to make sense; the way context is communicated across the tokens, those giant lists of vectors being tuned by the attention mechanism but only based on the data it is exposed to.
This limits what the system is able to learn. Without realising it, we had skewed our results by not letting the system see enough data where trees appeared to one side of the rails or the other. This experience was invaluable, as it in turn taught us a lesson too – computers and machine learning systems are not all-powerful, they can be just as fallible as us humans.