Large-scale, automated point classification – the future of lidar
Pooja Mahapatra, Solution Owner – Geospatial, Fugro talks to Geospatial Engineering
THE landscape of our planet is changing all the time. Many asset owners and government agencies are now seeking improved, recurrent geospatial data at scale, along with visualisation tools, to help them identify and manage change, and predict trends.
Geospatial Engineering spoke to Fugro’s Pooja Mahapatra, Solution Owner – Geospatial, to find out more.
What’s prompting these changes to the landscape?
There are many different causes, including population growth and urban expansion, as well as climate change and the increased frequency of natural disasters that are altering the shape of rivers, eroding shorelines and damaging infrastructure.
How are clients’ lidar data needs changing?
The development of advanced lidar production techniques and technology has moved things on considerably, meaning that it is now possible to classify lidar data at scale without compromise.
Lidar has been used successfully for many years to map bare earth, infrastructure, vegetation and hydrologic features. But clients such as asset owners and government agencies are now demanding more.
They want better quality lidar data. They want to acquire it at scale. They want to be able to measure change and predict trends.
And they want the data presented in a way that’s easy for them to manage, interpret and understand.
Is a single lidar set enough?
If it’s of high quality and is well classified, a single lidar dataset can provide a wealth of information about the area at the point in time when the data was acquired.
It can be an extremely useful tool for government agencies e.g. when managing floodplains and planning how land will be used.
However, it merely provides a snapshot of the present – without a previous snapshot to compare it against, it can’t be used to identify what has changed.

So is recurrent lidar data the answer?
It’s certainly part of the answer, yes. In our experience, most government agencies tend to refresh their datasets every three, five or 10 years. But what we’re finding is that many users of Geo-data are now wanting to extract more value from their lidar programmes by performing the surveys more often and performing advanced big-data analytics on the acquired data.
Comparing the datasets enables them to identify changes – environmental and manmade – more rapidly. It enhances their understanding and their ability to improve asset maintenance, protect the environment and keep people safe. More frequent surveying activities will of course have cost implications, so it’s important to optimise the value that you’re able to extract from multiple datasets.
How can I get more value from recurrent datasets?
Until recently, scaling up lidar would always have involved some sort of compromise – quality, accuracy, processing or speed
Rather than solely using traditional time-consuming classification methods, harness the power of the cloud and incorporate an element of automation too. Relying on desktop software and human interpretation to do all the classification work requires a significant amount of time.
For example, a point-classification expert would build complex and often project-specific macros on desktop software and run them on raw unclassified lidar point clouds.
They would look at the outputs and either tweak the macros and rerun, or manually clean up the results, labelling a feature to indicate that it represents a tree, or a building, road, culvert and so on. It’s a labour-intensive, slow process.
Doing it well requires time and resources, which increase your project costs. And it is not scaleable.
With a machine-learning solution in the cloud, the initial effort is automated with a single push of a button, labelling particular features based on clever algorithms and previous experience, which only gets better over time.
Human point-classification experts then review the labels and make fine corrections where needed. This approach produces a more accurate result, more speedily, even at scale.

Does scaling up have a negative impact on quality?
Until recently, scaling up lidar would always have involved some sort of compromise – quality, accuracy, processing speed or client data output expectations may have taken the hit, for example. But the development of advanced lidar production techniques and technology has moved things on considerably, meaning that it is now possible to classify lidar data at scale without compromise.
Is automated classification now possible?
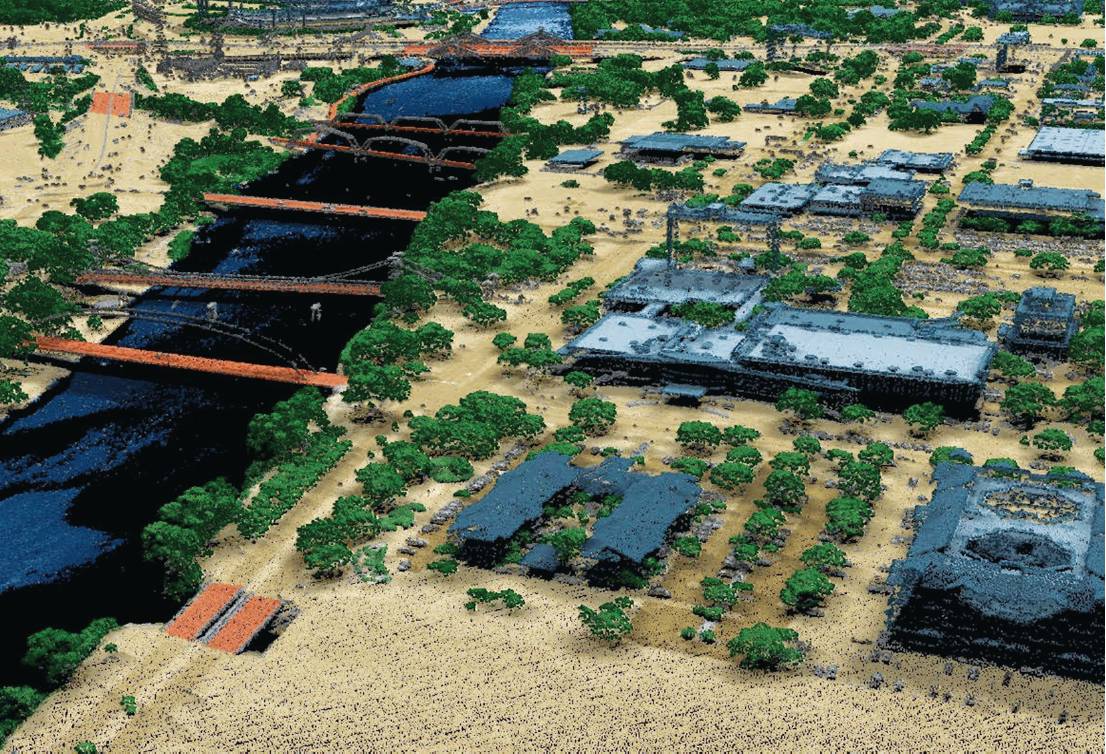
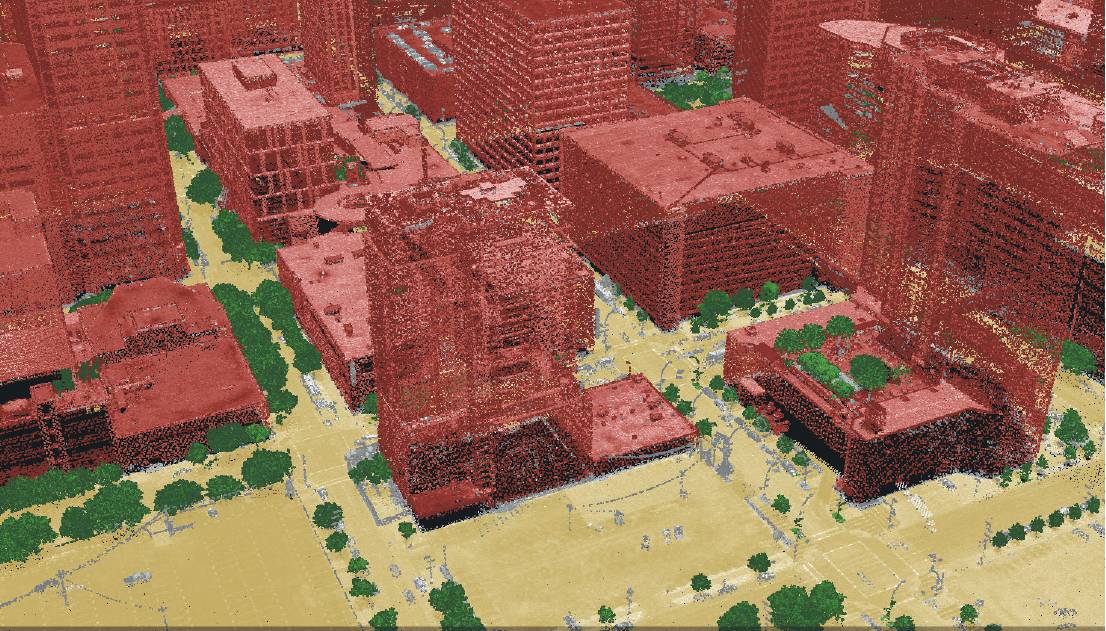
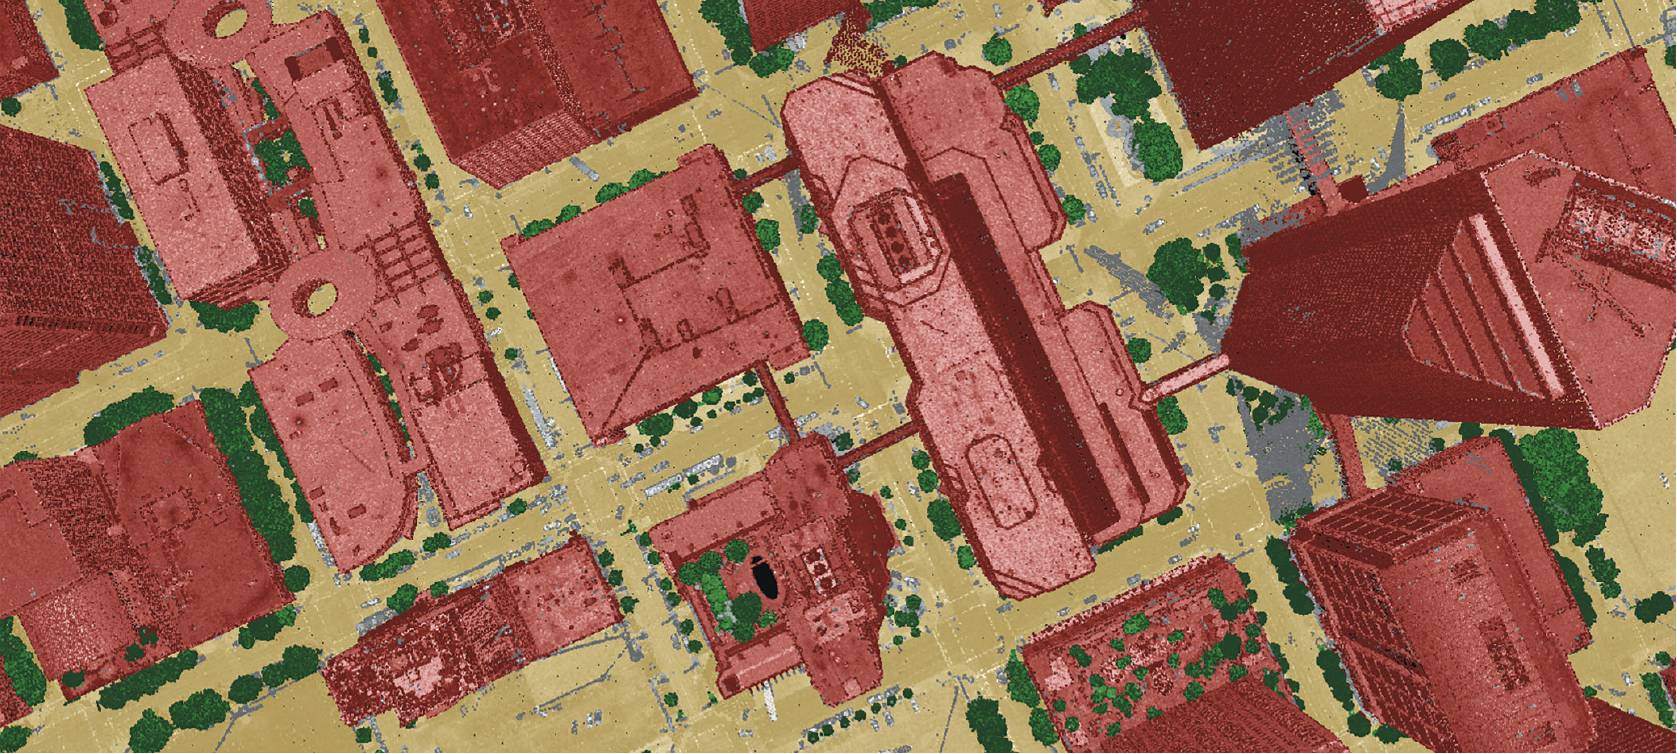
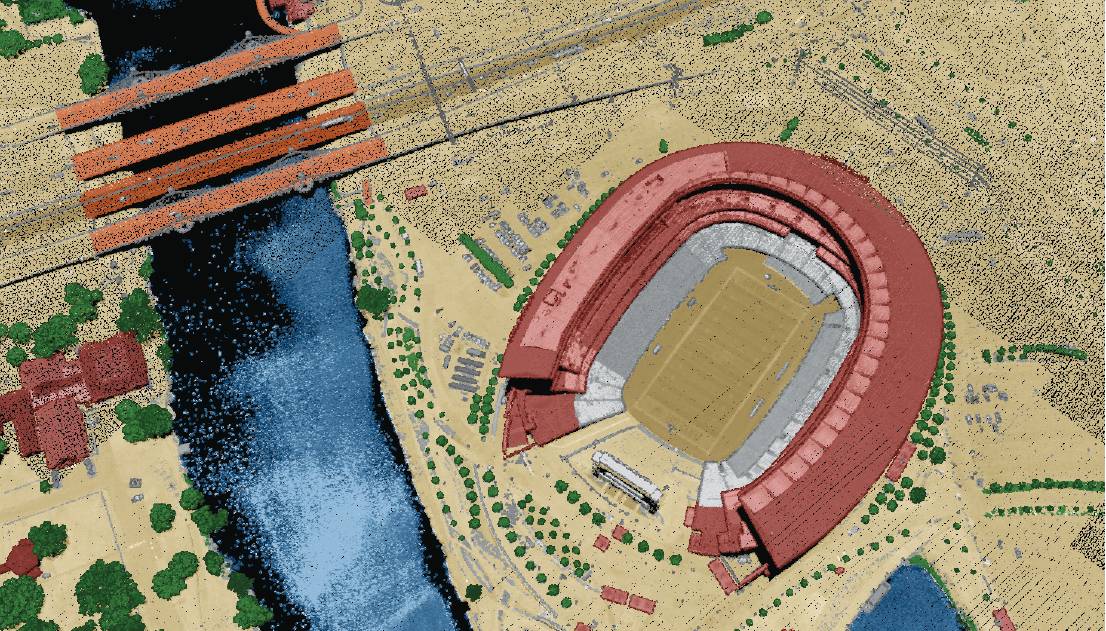
Fugro’s advancement in lidar production processes is based on using machine learning to label earth features like bare earth, buildings, utility assets, hydro, vegetation and so on, within lidar point clouds. It’s all done at scale, without hiking up costs, lowering quality or reducing speed.

Is this related to digital elevation models (DEMs)?
The DEMs effectively ‘strip’ all the information from above the earth, such as trees, buildings and assets.The DEMs effectively ‘strip’ all the information from above the earth, such as trees, buildings and assets.
This enables the user to see the bare earth, its shape and contours, how water would naturally flow through it and how it would drain.
DEMs are commonly used for floodplain analysis, to predict where problems may arise as a result of a storm event or river drainage.
The trouble is, when DEMs ‘remove’ the buildings that would obstruct the water flow, they sometimes leave an indentation, which then causes artificial pooling of water within the model. This can give rise to inaccurate calculations of water volume and flow. However, improved lidar point classification e.g. through our Sense.Lidar machine-learning solution improves DEM quality too.
What is the value of such lidar-derived digital twins?
A digital twin provides a platform that allows you to use the classified lidar data to test hypotheses and ‘what if’ scenarios from your desktop. It’s not just a replica of the current world; you can add and delete features at will – in fact, the simulation possibilities are endless.
Lidar-derived digital twins can drive down your operational costs significantly. That’s because you’ll reduce the need for inspections, which can represent around 20% of the total cost of conducting an aerial survey. They improve project costs because there is no longer any need for third-party inspections on high-quality data.
And when used for predictive analysis, they can help you to plan more effectively and arrive at informed decisions more quickly.

Can texturing improve these digital twins?
By combining efficient lidar data acquisition, artificial intelligence (AI), cloud processing and the indispensable human point classification expertise, it’s possible to achieve impressive production efficiencies and accommodate projects of all sizes.
Rather than flattening the area by obscuring a building, adding texture enables the user to visualise the building.
It’s a better representation of the feature. It’s like a digital ‘skin’ that wraps around a feature, so that it’s easily recognisable as a commercial building, a block of flats, a house, a shed or a tree, for example.
With our Sense.Lidar machine-learning solution, bringing the lidar point cloud back into the digital twin makes it possible to turn the fully textured 3D model off and on easily during the analysis. This gives the 3D model added flexibility.
Does it still need human interaction, to make it a quality product?
Yes. It’s not just a case of plugging something into a machine and then out pops a product that’s ready to use. Our experts understand how to manage and work with the data – they use machine-learning to distil it all down so that manual effort goes only into the important last mile.
Is it possible to scale things up – to town, regional and even country levels?
Yes. By combining efficient lidar data acquisition, artificial intelligence (AI), cloud processing and the indispensable human point-classification expertise, it’s possible to achieve impressive production efficiencies and accommodate projects of all sizes. All of this must be done without losing data integrity. That’s essential.
Let’s say you’re trying to scale up a massive data-collection exercise like a coastal mapping programme, by making it a yearly task. If it takes six months to mobilise, fly along the coastline and acquire all the data and then you have to spend a further year processing it, that’s not scalable.
By the time the information is ready for the client review, it’s already well out of date.
But if the results could be delivered within a month, the client would have five months to analyse it and make informed decisions based on it, ahead of the next data acquisition round.
What Geo-data insights can be gained from iterative programmes?
When lidar surveys are carried out frequently, you can use the wealth of Geo-data acquired to identify changes and predict trends. For example, if lidar data is collected every five years for an area of interest, comparing datasets will reveal how the earth is changing; if trees are growing or dying; if the urban sprawl is adversely affecting infrastructure or the natural environment; and if a neighbourhood has been built on a floodplain.
Predictive analysis techniques will indicate how the area will continue to change, to inform management planning.
Where have machine learning point classifications been applied?
There is a lot of existing lidar data that could be used more if the classifications were improved. It’s still early days but we’ve been applying machine-learning point-classifications to existing and newly acquired lidar data over very different land cover types around the world.
When lidar surveys are carried out frequently, you can use the wealth of Geo-data acquired to identify changes and predict trends.
They range from coastal, urban and rural areas (Australia) to unique building structures (Romania) and coastal cliffs (Ireland).
In March 2021 we were asked to do a lidar classification project in Texas, USA. The survey area covered 83,184 square miles (215,446km²) and included 15 land types.
Our task was to take the existing federal-specification United States Geological Survey (USGS) lidar data and enhance it to 99% accuracy (the state’s minimum requirement for lidar classification). The Texas project was at 2ppsm (points per square metre) so we focused on vegetation, buildings and culverts for the enhancement work.
In another US state we collected data at 200ppsm with our fixed-wing aircraft, and were able to use machine-learning to extract far more features, including power utility infrastructure, road assets, fences, sport complex assets and the fine details of a building.
What benefits did you bring to your Texas client?
Minimising the human effort involved in classifying the lidar datasets and cloud-based automated processes meant we were able to complete the task 39% faster. Buildings, vegetation (low, medium, high) and culverts were classified, more accurately and to a higher quality, with no impact on cost. This will enable improved models to be built from the lidar data, enabling better decisions in the end.
What’s on the horizon?
Digital twins are really making a move in our industry. This Geo-data allows users to accurately and more safely manage assets from the desktop and reduce boots on the ground. When applying a lidar-based digital twin to projects or activities, users are significantly lowering operational costs.
The type and volume of lidar classifications will no doubt continue to increase, enabling Geo-data users to analyse more past, present and future changes. Over time, machine-learning algorithms will keep improving, driving up the accuracy, speed and reliability of automated lidar point classifications.
Their application could extend beyond flood risk management and land planning to include forestry analysis, energy operations, infrastructure planning, agriculture monitoring, broadband management and various design programmes.
The overarching goal is to improve the quality of newly acquired and existing lidar data. Because when lidar point cloud classifications are of exceptional quality, they enable better decisions that help build a safe and liveable world.
Pooja Mahapatra, Solution Owner – Geospatial, Fugro was talking to Geospatial Engineering